Diversification has been called “the only real free lunch in the investment world,” and all sorts of diversification may be beneficial to investors including asset class diversification (holding real estate, stocks, and bonds as well as cash), geographic diversification within the U.S. (holding assets in different parts of the country), property type diversification within the real estate asset class, and cross-country diversification. Diversification benefits don’t come automatically, though: in every case, the benefits have to be proven empirically, not just assumed.
Thanks to NAREIT’s partnership with FTSE Russell and the European Public Real Estate Association (EPRA), investors have data on the total returns to real estate investment through listed REITs and other listed property companies (LPCs) in all developed countries going back to the beginning of 1990 (that’s slightly more than 27½ years), and in emerging countries going back to March of 2005 (that’s 12½ years).
I thought it would be a good time to review the investment returns of the global listed property universe. Here’s what the data show: investors have enjoyed better volatility-adjusted returns (in US dollars) from exchange-listed equity REITs right here in the U.S. than from any broad overseas listed real estate portfolio—better than global investments, better than developed-country investments, better than emerging-country investments. Over historical periods longer than just the past year, moreover, U.S. listed equity REITs have outperformed listed real estate in developed countries in both of the other regions: better than European investments, better than Asia/Pacific investments. When you add in the fact that listed real estate holdings in the U.S. do not expose investors to many of the other risks that are common in international investing, especially in less-developed countries—risks associated with political upheaval and the rule of law, not simply currency fluctuations—it’s clear that U.S. investors haven’t suffered, on a risk-adjusted basis, by focusing exclusively on their home country.
When comparing U.S. and global real estate returns, the first thing to bear in mind is that the U.S. accounts for well over half of the global opportunity set. The global market for exchange-traded REITs and other LPCs now exceeds 1.6 trillion U.S. dollars according to the FTSE EPRA/NAREIT Global Real Estate Index, while the aggregate market cap of listed U.S. REITs was USD 1.126 trillion at the end of August 2017 according to the FTSE NAREIT All REIT Index; market cap totaled USD 1.056 trillion for listed U.S. equity REITs, which perhaps is the most relevant comparison since mortgage REITs aren’t in the non-U.S. universe.
The FTSE EPRA/NAREIT Global Real Estate Index encompasses (as of the end of August 2017) 482 companies: 178 in the Americas region, 179 in the Asia/Pacific region, and 125 in the Europe, Middle East & Africa (EMEA) region. In terms of market cap, the Americas accounted for 51% of the global total, with another 32% in Asia/Pac and the remaining 17% in EMEA.
Most of the market cap is in developed countries: the FTSE EPRA/NAREIT Developed Real Estate Index encompasses 335 companies worth a total of USD 1.441 trillion with 56% in the Americas (just the U.S. and Canada), 27% in Asia/Pac and 17% in Europe. The FTSE EPRA/NAREIT Emerging Real Estate Index had 147 companies worth USD 181 billion distributed 75% in Asia/Pac, 13% in EMEA, and 12% in the Americas.
It’s also important to note that non-REITs play an important role outside the U.S.—especially in the Asia/Pacific region, where many listed property companies are quite active in property development—but not within the U.S. That can be either good or bad: non-REITs (especially homebuilders or other developers) may be riskier than REITs, but they may also provide a diversification benefit within a broad real estate portfolio because their returns may be driven in part by factors other than simply the returns from holding and managing income-producing property.
Let’s start by comparing returns (in USD) as shown in Table 1. Over the longest historical period available for comparison, starting at the end of 1989, listed equity REITs in the U.S. have provided gross total returns averaging 10.82% per year compared to just 7.76% per year for the Developed index. In fact, it’s very striking that average annual returns for the FTSE NAREIT All Equity REIT Index exceeded those of the FTSE EPRA/NAREIT Developed Real Estate Index over every historical period shown in Table 1: the past 1 year (1.85% vs 0.84%), 3 years (8.37% vs 4.63%), 5 years (9.87% vs 8.00%), and 10 years (6.60% vs 3.20%), plus the 12½-year period since the inception of the other indices in the FTSE EPRA/NAREIT series at 2/28/05 (8.62% vs 6.74%).
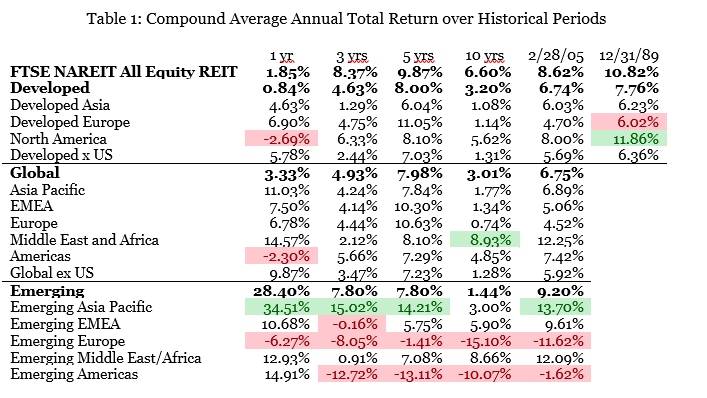
Annual average total returns in U.S. dollars have been higher in emerging markets than in developed markets since 2/28/05 (9.20% vs 6.74%) and more recently (7.80% vs 4.63% over the past three years, and a whopping 28.40% vs 0.84% over the past year—a period during which emerging-market returns more generally have been exceptionally strong). Table 1 shows, however, that those high returns have been confined almost exclusively to emerging markets in the Asia/Pacific region (and, to a lesser extent, Middle East/Africa) while emerging markets in Europe and the Americas have posted negative returns in U.S. dollars over most of the historical periods shown.
Not unexpectedly, Table 2 shows that the volatility of total returns (in U.S. dollars) has generally been substantially higher in emerging markets than in developed markets. A portfolio of assets whose returns respond to different drivers will often have lower volatility than a portfolio of assets whose returns respond to a common set of drivers, so it’s no surprise that an index for an internationally diversified portfolio of developed countries (such as the FTSE EPRA/NAREIT Developed, or Developed ex US) would show slightly less volatility than a index of just one developed country such as the FTSE NAREIT All Equity REIT—it is surprising, however, that the Developed x US index showed greater volatility than the All Equity REIT index over the longest historical period available for comparison (19.4% vs 18.5%).
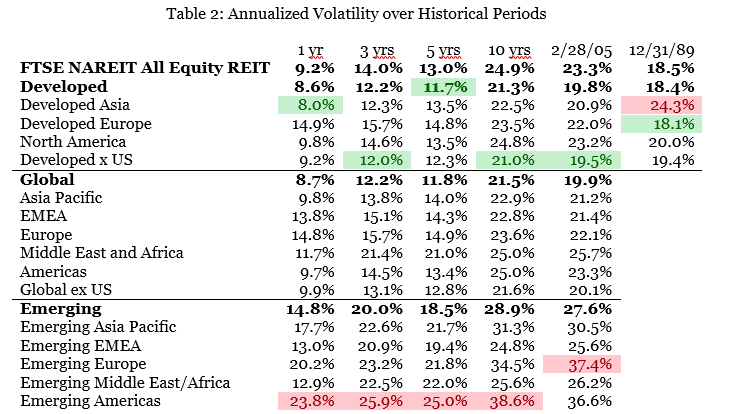
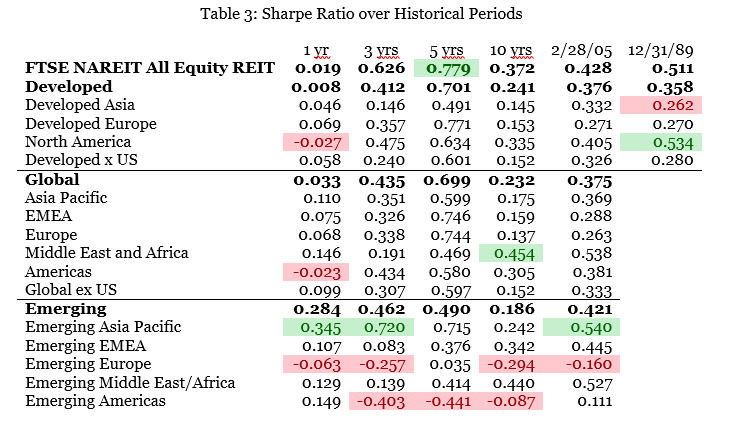
Table 3 combines the results from Tables 1 and 2 to show the Sharpe ratio measuring risk-adjusted returns. Four findings are especially striking:
- Listed equity REITs in the U.S. (the FTSE NAREIT All Equity REIT Index) have generally provided higher risk-adjusted returns than those from a diversified portfolio of listed property companies from developed countries (the FTSE EPRA/NAREIT Developed Index), with Sharpe ratios of 0.019 vs 0.008 over the past year, 0.626 vs 0.412 over the past 3 years, 0.779 vs 0.701 over the past 5 years, 0.372 vs 0.241 over the past 10 years, 0.428 vs 0.376 over the past 12½ years, and 0.511 vs 0.358 since the starting date of the Developed index at the end of 1989.
- Listed U.S. equity REITs also outperformed the Global index over every historical period longer than 1 year (0.626 vs 0.435 over 3 years, 0.779 vs 0.699 over 5 years, 0.372 vs 0.232 over 10 years, and 0.428 vs 0.375 over 12½ years) despite the exceptionally high returns from emerging markets and the benefits of diversification across the full set of global markets.
- Listed U.S. equity REITs also outperformed the Emerging index over every historical period longer than 1 year (0.626 vs 0.462 over 3 years, 0.779 vs 0.490 over 5 years, 0.372 vs 0.186 over 10 years, and 0.428 vs 0.421 over 12½ years) despite, again, the exceptionally high returns from emerging markets and the benefits of diversification across emerging countries.
- Within the Developed market category, listed U.S. equity REITs in the U.S. outperformed both of the other two regions, Asia and Europe, over every historical period longer than 1 year, with Sharpe ratios of 0.626 vs 0.146 and 0.357 over 3 years, 0.779 vs 0.491 and 0.771 over 5 years, 0.372 vs 0.145 and 0.153 over 10 years, 0.428 vs 0.332 and 0.271 over 12½ years, and 0.511 vs 0.262 and 0.270 since the end of 1989.
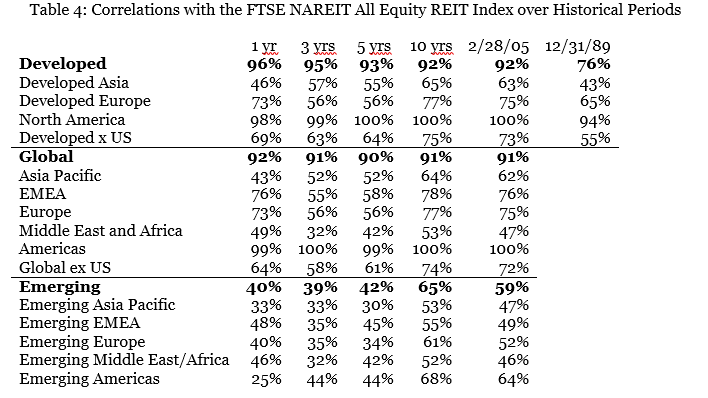
Finally, Table 4 shows the correlations in monthly total returns between listed U.S. equity REITs and each of the global or regional portfolios. It’s not surprising that correlations between the U.S. and non-U.S. markets tend to be fairly low: clearly there is value in holding a portfolio of listed real estate that is diversified not just by property type and geographically within the U.S. but also globally, provided that your non-U.S. holdings do not provide very poor risk-adjusted returns.
A couple of the empirical results shown here confirm what should generally be expected:
- Returns from emerging markets are generally much more volatile than returns from developed markets.
- Returns from emerging markets also may be much higher than returns from developed markets, or much lower. In short, there’s much greater risk in emerging markets—not just volatility but also dispersion and other forms of uncertainty—and there’s no guarantee that investors will be compensated for bearing that risk.
To my mind, though, the most important take-away from this analysis is the strength of listed U.S. equity REITs on a risk-adjusted basis: as Table 3 showed, over most historical periods they have provided higher Sharpe ratios than the Developed index and the Global index and the Emerging index and the Developed Asia index and the Developed Europe index. In short, the historical evidence suggests that investors who have limited the focus of their real estate investments to exchange-listed opportunities in the U.S. have not suffered from “home country bias”—in fact, they’ve done very, very well.
By the way, if you have any comments or questions please drop me a note at bcase@nareit.com.