In two recent market commentaries I analyzed the inflation-protecting attributes of REITs and four other assets: commodities, TIPS, stocks, and gold. In the first, published on July 16, I laid out a sensible way of thinking about exactly what we want from an inflation-protecting asset and showed that commodities and REITs have most dependably protected purchasing power during periods when inflation turned out to be relatively high . In the second, published on July 18, I warned against depending on commodities as your primary inflation-protecting assets because commodity returns have been absolutely horrendous on average during periods when inflation turned out to be relatively low .
If you knew for certain that inflation were going to be relatively high over the next six months, then you could simply choose the asset whose returns are typically highest during high-inflation returns (commodities)—but, while we may have reasonably high confidence that inflation is going to be high, none of us knows for certain. In low-inflation environments commodities have been the worst asset, with negative returns on average—so investing heavily in commodities exposes investors to substantial prediction risk (also called direction risk because of the big differences in outcomes depending on the direction that inflation takes).
With multiple assets to choose from, though—at least four of which seem to have some inflation-protecting attributes at least some of the time—it’s more than likely that investors can form a basket of assets that will protect against prediction risk while also protecting against inflation nearly as well as (and possibly even better than) any asset on its own. That’s essentially a message about the value of having a diversified portfolio in all circumstances: nobody can know what the future will bring, so we want to protect against the worst-case scenario that every asset presents.
One way to design a diversified inflation-protecting portfolio is simply to conduct a Markowitz-type mean-variance portfolio optimization using real returns (total returns minus the inflation rate) instead of nominal returns (total returns as measured). It’s worthwhile noting that, while one always has to be careful with portfolio optimizations—because the results can be very sensitive to the capital market assumptions—that caution is especially worth keeping in mind in the current application because one of my inflation-protecting assets is TIPS, which only became available in 1997. The problem is that there really hasn’t been much inflation since then, so we would like to use data for TIPS (and other assets) going back to the genuinely high-inflation periods of the 1970s and early 1980s. For that purpose I use the monthly TIPS returns that were back-filled by Ibbotson Associates for periods prior to December 1997: if I can’t have my first choice—actual returns for TIPS during those genuinely high-inflation periods—then Ibbotson Associates is certainly a good second-best.
If we use monthly returns for the same set of five assets over the historical period January 1978 – June 2018 to construct our capital market assumptions, and then choose the optimized portfolio that maximizes the Sharpe ratio (in real terms), then the first column of Table 1 shows us what the analysis would suggest: a portfolio allocated 45.5 percent to TIPS, 26.0 percent to stocks, 15.0 percent to REITs, 8.2 percent to commodities, and 5.3 percent to gold. The real returns for that portfolio would have averaged 7.19 percent per year with 11.8 percent volatility, giving risk-adjusted returns with a very respectable Sharpe ratio of 0.536.
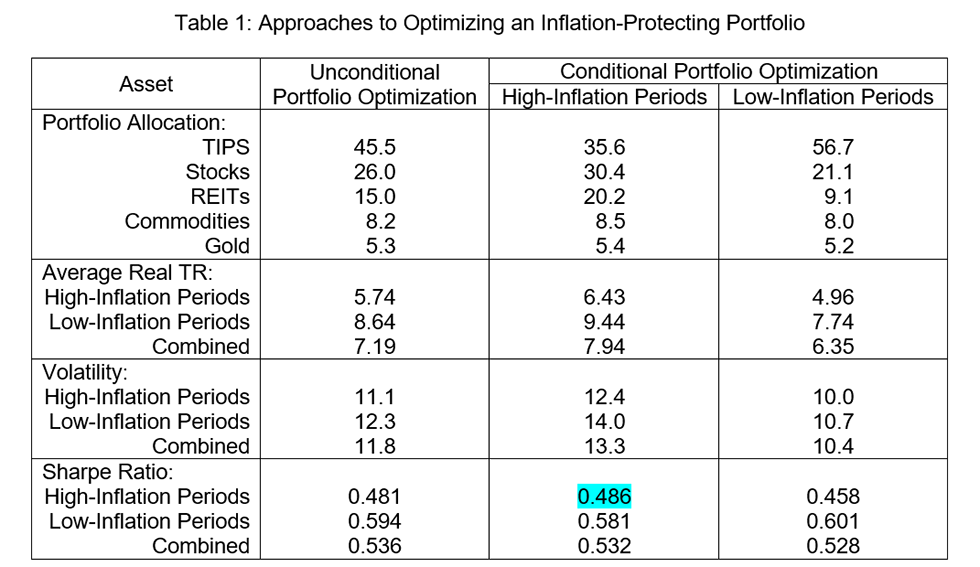
I’m going to suggest a different approach, however. The problem with the “unconditional” approach is that investors will still be much worse off, in risk-adjusted terms, during high-inflation periods than during low-inflation periods. During low-inflation periods the real returns would average 8.64 percent per year with 12.3 percent volatility for a Sharpe ratio of 0.594—but during high-inflation periods the real returns would be substantially lower, averaging 5.74 percent per year, but volatility would be only slightly lower at 11.1 percent, so the Sharpe ratio would be considerably lower at 0.481.
Here’s the approach that I prefer to minimize direction risk: choose the portfolio that maximizes risk-adjusted returns in the less-favorable state, so that your returns are as strong as possible, on a risk-adjusted basis, even if the world goes in the worst direction. In this context, the worst direction is the high-inflation environment, so my recommendation is to choose the portfolio that maximizes the (real) Sharpe ratio in high-inflation environments. The portfolio that meets that criterion, given the returns we’ve observed since the beginning of 1978, is this: allocate 35.6 percent to TIPS, 30.4 percent to stocks, 20.2 percent to REITs, 8.5 percent to commodities, and 5.4 percent to gold.
The payoff to my conditional approach is that, during high-inflation periods, average real returns would have been considerably higher (6.43 percent per year compared with 5.74 percent per year under the “unconditional” approach), more than enough to make up for the somewhat higher volatility (12.4 percent compared with 11.1 percent), so the Sharpe ratio would have been higher at 0.486 compared with 0.481. Is that a huge improvement in risk-adjusted returns? No—but the point is that it came during specifically those periods when risk-adjusted returns would have been worst for investors who followed the unconditional approach.
Notice how the two portfolio allocations differ: using the “unconditional” implies greater investment in TIPS, which—at least according to the analysis that Ibbotson Associates did for the purpose of back-filling returns prior to December 1997—haven’t protected purchasing power very dependably during high-inflation periods and have provided almost the same returns during high-inflation periods (7.1 percent per year on average) as during low-inflation periods (6.9 percent per year on average). That’s why the risk-adjusted returns under the unconditional approach are so much worse during high-inflation periods than during low-inflation periods. My suggested “conditional” approach, however, implies greater investment in stocks (up from 26.0 percent to 30.4 percent) and especially REITs (up from 15.0 percent to 20.2 percent), which have helped portfolios provide better returns, especially on a risk-adjusted basis, during high-inflation periods: that’s why the difference between the “best-case” and “worst-case” scenarios is so much less egregious.
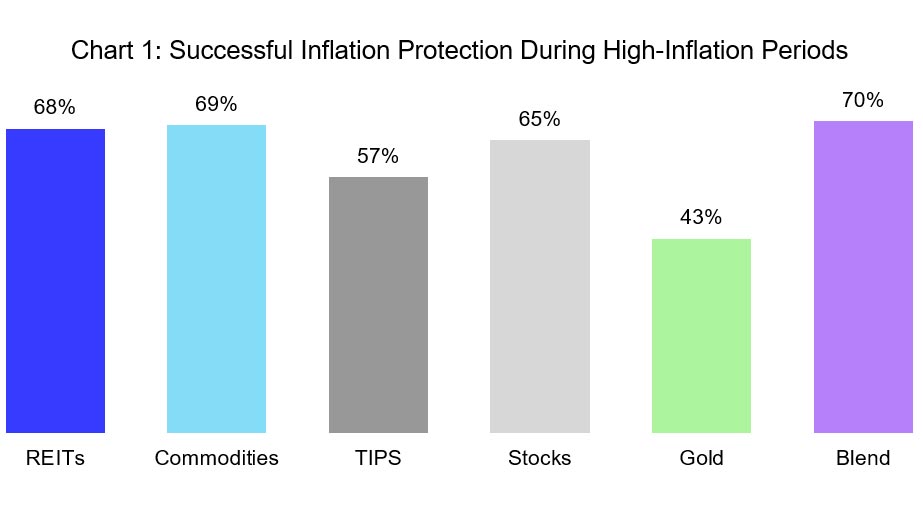
Now let’s turn back to the “batting average” framework that I advocated in my market commentary from July 16. Chart 1 below is the same as the one I presented in that commentary, but I’ve added the blend of inflation-protecting assets that I just laid out: the diversified inflation-protecting portfolio that maximized risk-adjusted returns in the less-favorable state. This blend—with 35.6 percent allocated to TIPS, 30.4 percent to stocks, 20.2 percent to REITs, 8.5 percent to commodities, and 5.4 percent to gold—would have provided total returns exceeding the inflation rate during 70 percent of the high-inflation periods that we’ve observed since the beginning of 1978. In other words, the inflation-protecting blend protected purchasing power more dependably than any of these inflation-protecting assets on their own.
In your own investment portfolio you may be considering a wider range of inflation-protecting assets than the five shown here: for example, many investors are interested in the inflation-protecting potential of infrastructure investments (which you can access through REITs, because of course infrastructure is another form of real estate). As I noted in my July 16 market commentary, you may also want to consider other definitions of “high-inflation periods.” Regardless of how you may want to tinker with the details, I hope what I’ve done for you lays out a thoughtful framework for thinking about what you actually hope to accomplish when you set out to protect your portfolio from inflation—a framework that doesn’t get distracted by statistics that are meaningless for this particular purpose (correlations) and also doesn’t send you off half-cocked into assets that may end up punishing you for guessing wrong (commodities).
Note for philosophy nerds: my suggested approach can be thought of as an application of the maximin principle laid out by John Rawls in his monumental 1971 book A Theory of Justice. (Of course Rawls’s concerns were primarily about ethics and social or economic inequality, rather than about inflation protection!)
Details: REIT total returns come from the FTSE Nareit U.S. Real Estate index series, stocks from the S&P 500 Stock Index, and commodities and gold from the S&P GSCI. For TIPS I use the Bloomberg Barclays TIPS index with monthly returns back-filled by Ibbotson Associates for months prior to December 1997. I use the U.S. city average all-item CPI, not seasonally adjusted. I’ve used various definitions for “high-inflation periods,” and the numbers change but the qualitative results don’t. If you have any questions or comments, please drop me a note at bcase@nareit.com.