There’s a proverb that states, “Guests, like fish, begin to smell after three days.” Although this adage has earlier roots, it is often attributable to Benjamin Franklin and his Poor Richard’s Almanack. It is a sentiment that appears to have endured the test of time and many still find it relatable today.
It seems that commercial real estate (CRE) may have its own unwanted visitor. Coming into 2025, Nareit believed that CRE may have finally been able to say goodbye to the divergence between public and private real estate values.
In the third quarter of 2024, material progress had been made in closing the gap between REIT implied and private appraisal cap rates, but then markets changed. REIT implied cap rates pushed higher in the fourth quarter and private appraisal cap rates dropped. The cap rate spread widened further by mid-year 2025.
While CRE’s lingering valuation problem has stunted property transactions, it continues to present an opportunity for real estate investors. As public and private property values become more in sync with one another, REITs are anticipated to maintain investment performance and acquisition advantages over their private market counterparts.
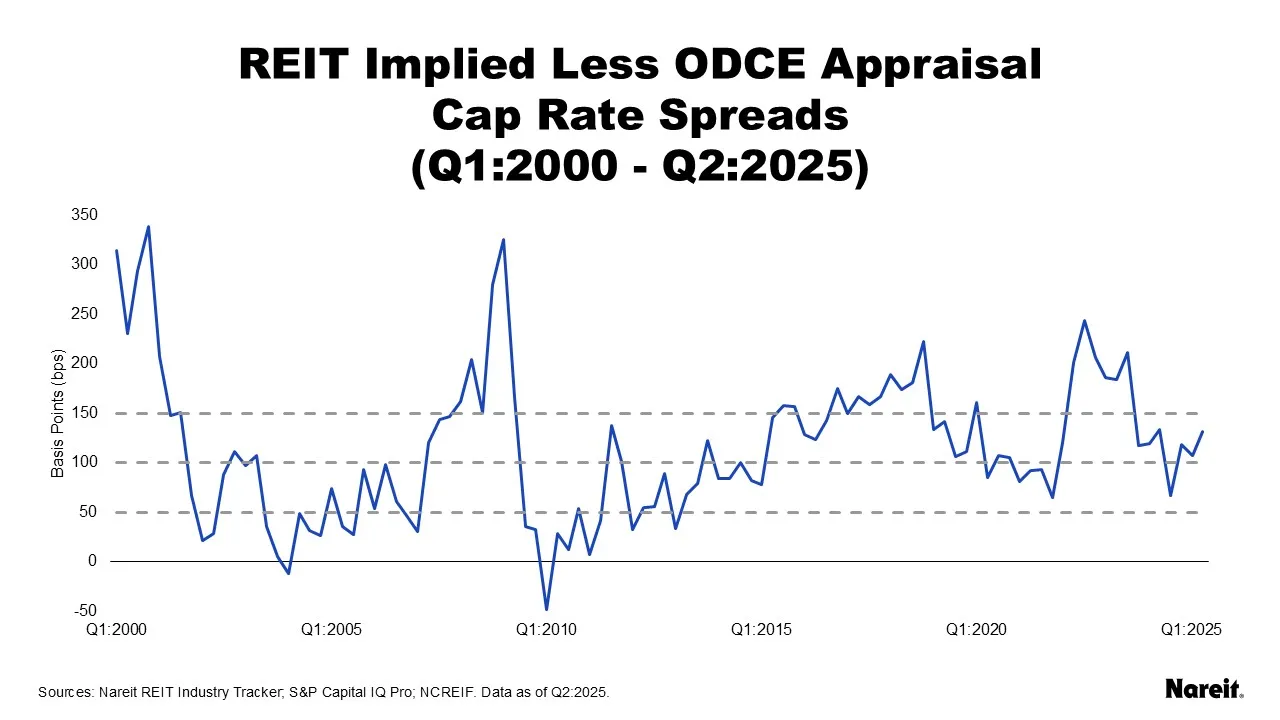
The chart above displays public less private real estate cap rate spreads from the first quarter of 2000 to the second quarter of 2025. REIT implied cap rates are from Nareit’s quarterly REIT Industry Tracker. Private appraisal cap rates focus on properties from open end diversified core equity (ODCE) funds from the National Council of Real Estate Investment Fiduciaries (NCREIF). The chart also includes three horizontal gray dashed lines at 50, 100, and 150 basis points (bps) that divide it into four regions.
Assigning each cap rate spread into one of the four regions showed that similar numbers of observations were found within each group. The first region (cap rate spread ≤ 50 bps) had 21 data points; two were negative. The second (50 bps < cap rate spread ≤ 100 bps) and third (100 bps < cap rate spread ≤ 150 bps) regions had 25 and 27 observations, respectively. The tally in the fourth region (cap rate spread > 150 bps) was 29 with 13 greater than 200 bps. The roughly even distribution of data points across cohorts highlights the dynamic nature of CRE pricing.
Since 2000, the public-private cap rate spread had four major peaks, i.e., local maximums. At these points, public and private real estate valuation divergences were at their most extreme levels. After reaching these crests, the cap rate spreads tended to plunge, allowing for greater alignment of public and private real estate values.
- In Q4:2000, the cap rate spread was 339 bps, the highest observed level. This occurred one quarter prior to the start of the tech driven, i.e., dot-com bust, recession. Five quarters after this peak, the cap rate spread was 21 bps.
- In Q1:2009, the cap rate spread was 325 basis points. This was in the midst of the recession related to the global financial crisis. Four quarters after this peak, the cap rate spread was -48 bps; one of two periods where the spread was negative.
- In Q4:2018, the cap rate spread was 222 basis points. Twelve quarters after this peak, the cap rate spread was 65 bps. The cap rate decline spanned the COVID outbreak and a brief recession.
- In Q3:2022, the cap rate spread was 243 basis points. This peak coincided with a surge in the 10-year Treasury yield. Eight quarters after this peak, the cap rate spread was 67 bps, but it has since nearly doubled. This dislocation does not yet appear to be over.
Historically, REITs have also been apt to materially outperform private real estate in the post-peak periods on a total return basis.

The chart above presents four-quarter and peak-to-trough total return differences between public and private real estate after each of the four major cap rate spread peaks, as well as the number of quarters in each peak-to-trough period. Total return differences were calculated using FTSE Nareit All Equity Index (FTSE Nareit) and National Council of Real Estate Investment Fiduciaries Fund Index–Open End Diversified Core Equity (NFI–ODCE) data. Positive values indicate REIT outperformance. All performance metrics reflect cumulative total returns.
After each of the four major peaks, REITs outperformed private real estate on both four-quarter and peak-to-trough total return bases. The four-quarter REIT total return outperformance ranged from 8.3% to 124.7% and averaged 41.7%. The peak-to-trough REIT outperformance ranged from 17.1% to 124.7% and averaged 58.8%.
After the most recent peak, four-quarter REIT outperformance was 10.4%. Interestingly, both public and private total returns were negative. The inability for property total returns to push into positive territory likely stemmed from headwinds related to rising interest rates. Peak-to-trough REIT outperformance was 51.0%, but the cap rate spread has increased dramatically since its perceived nadir. It increased by over 50 bps in the next quarter and now stands at 132 bps. This resurgence suggests that the current pricing dislocation may not yet be over.
The current lingering public-private real estate valuation divergence has been CRE’s unwanted visitor. While REIT implied cap rates have meaningfully reacted to financial market movements, private appraisal cap rates have been less responsive. With the NCREIF ODCE appraisal cap rate maintaining the approximate same level for three quarters, it’s as if appraisers and portfolio managers have abandoned the mark-to-market valuation process and, instead, embarked on a strategy of hope that the market will come to them. Although this dislocation has impeded the price discovery process and limited transactions, the current wide cap rate gap suggests that there still may be more fuel in the tank for REIT outperformance in the coming quarters.