The correlation between REITs and the broad stock market has always been relatively low, because REIT returns are driven by the real estate market cycle whereas returns for most other equities are driven by the much shorter business cycle. I’ve noted in previous market commentaries that the REIT-stock correlation has recently been especially low, so I thought I would dig a little more deeply into how closely REITs in different property type sectors have been correlated with stocks.
I’ll focus on 10 sectors or subsectors for which monthly returns are available back to the beginning of 1994: self storage, manufactured homes, health care, free standing retail, regional malls, shopping centers, apartments, industrial, office and lodging/resorts.
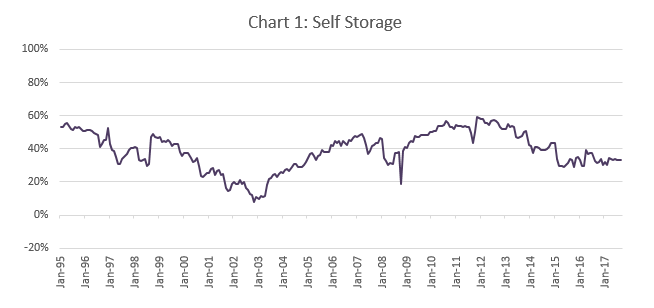
Self Storage
Chart 1 shows the correlation in monthly total returns between self storage REITs and the broad U.S. stock market. This chart illustrates an important point that you’ll see in several other sectors, too: REIT/stock correlations reached their peak not during the liquidity crisis—in fact, the correlation between self storage REITs and the broad stock market stayed in the 40% range throughout the Great Financial Crisis in late 2008 and early 2009—but rather in October 2011 when both of them had especially good returns (+16.64% for Self Storage REITs, +11.51% for the broad stock market). Even at its peak the correlation was just 59%, but since then it has declined sharply: As of September 2017, it was just 33 percent, down 26 percentage points from its highest value and 5.7 percentage points below its average value (39.0 percent) over the available historical period.
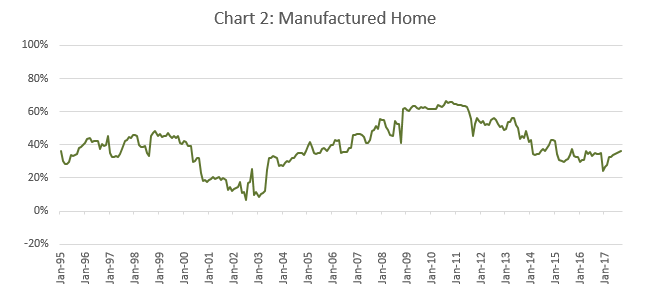
Manufactured Homes
Chart 2 shows the REIT-stock correlation for the manufactured homes subsector of residential REITs. In this case the correlation was relatively high during the Great Financial Crisis—though “relatively high” in this case means just the 60 percent range—and peaked at 66 percent in mid-2010 before declining sharply over the past seven years. As of September 2017, it was 36 percent, down 30 percentage points from its highest value and 4.0 percentage points below its average value of 40.0 percent.
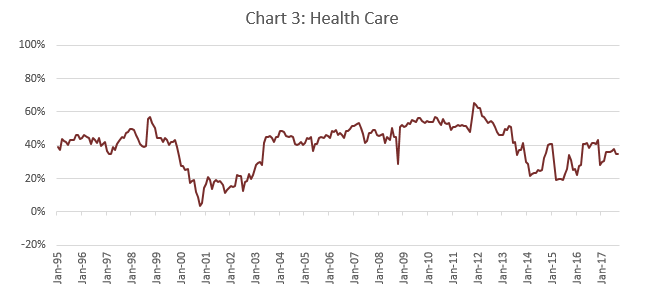
Health Care
Chart 3 shows the correlation between health care REITs and the broad stock market. After remaining in the 55 percent range during the Great Financial Crisis, the correlation showed a noticeable spike to a maximum value of 66 percent, but as with self storage REITs, the spike was associated with good news (total returns up 6.71 percent in October 2011) rather than the turmoil of 2008-09. The correlation declined rapidly through 2013, but since then it has fluctuated in the 20 percent to 40 percent range. As of September 2017, it was 35 percent, down 31 percentage points from its 2011 peak and 5.1 percentage points below its average value (40.0 percent) over the available period.
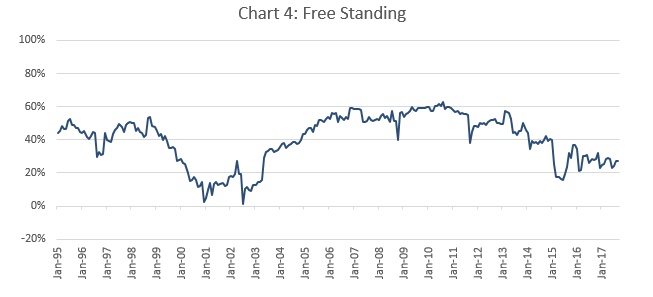
Free Standing
Chart 4 shows the correlation between the broad stock market and the free standing subsector of Rrtail REITs. Just as for the manufactured home subsector, the highest REIT-stock correlation for free standing REITs was in mid-2010 when it reached 63 percent. Since then, it has declined to the 25 percent range, and as of September 2017, it was just 27 percent. That’s 36 percentage points less than its peak, 13.0 percentage points less than its average (40.4 percent), and tied with shopping centers for the lowest of all REIT sectors/subsectors.
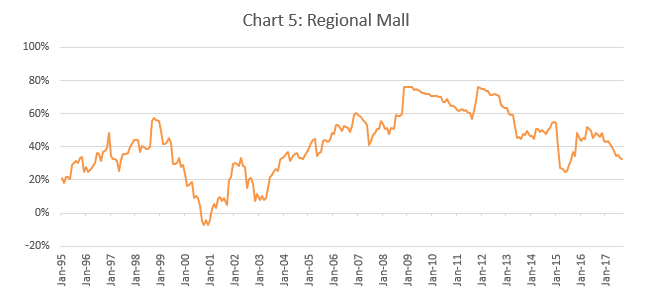
Regional Malls
Chart 5 shows the REIT-stock correlation for the regional mall subsector of retail REITs. In this case the highest correlation was, indeed, during the Great Financial Crisis, although its peak value of 76.2 percent was only microscopically higher than the later “good news” peak of 76.1 percent reached when regional mall REITs returned an amazing +18.69 percent during October 2011. Also note that the REIT-stock correlation for regional mall REITs actually reached negative territory during 2000, something only one other segment of the industry (shopping center REITs) has achieved during the available historical period. As of September 2017, the correlation was just 33 percent, which is 44 percentage points below its highest value and 9.7 percentage points below its average value of 42.4 percent.
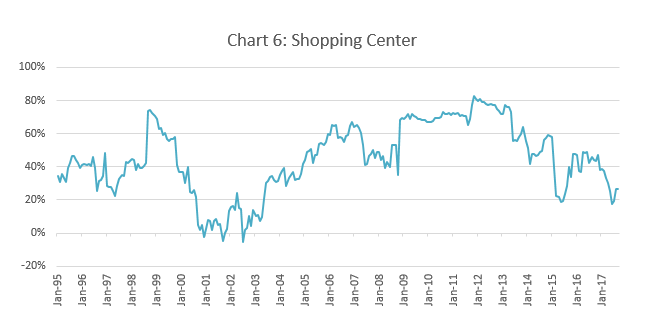
Shopping Centers
Chart 5 shows the correlation for the shopping center subsector of retail REITs. As with health care REITs, for shopping center REITs, the correlation with stocks remained stable during the Great Financial Crisis at a relatively high level—in the 70 precent range—but reached its maximum value of 83 percent only as a result of very strong returns (+12.78 percent) during October 2011. Since then, the correlation has declined very sharply: In fact, during each of the past five months, it has been the lowest of all REIT sectors, and as of September 2017, it was just 27 percent—a full 36 percentage points below its peak value and 13.0 percentage points less than its average value of 40.4 percent.
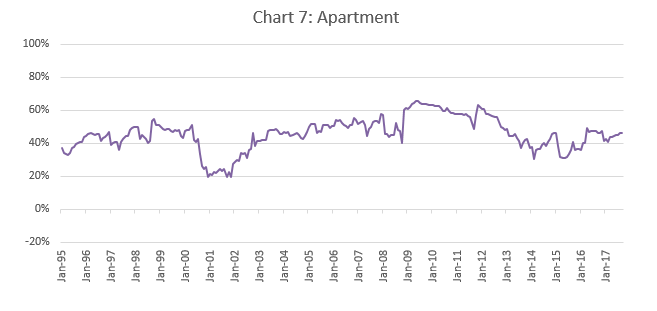
Apartments
Chart 7 shows the REIT-stock correlation for the apartment subsector of residential REITs. The range is noticeably smaller than for other sectors or subsectors of the REIT market: Most of the time, the correlation has been between 41 percent and 51 percent, meaning that the relationship between apartment REITs and the broad stock market has fluctuated relatively little. As with regional mall REITs, the REIT-stock correlation for apartment REITs peaked during the Great Financial Crisis, though its maximum value was only slightly higher (66 percent) than the 63 percent it reached as a result of apartment REITs’ +13.17 percent total return during October 2011. Over the past few years (as in earlier years), the correlation has remained relatively stable, and as of September 2017, it was 46 percent, which is 20 percentage points below its peak value, but almost identical to its average value of 45.9 percent over the available historical period.
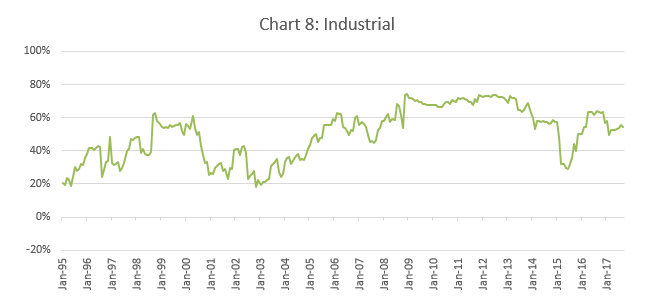
Industrial
Chart 8 shows the correlation between industrial REITs and the broad stock market. The pattern is similar to the apartment REITs pattern: The maximum value of 74 percent was reached during the Great Financial Crisis, but that was only a tiny bit higher than the 73.6 percent correlation reached after industrial REITs posted total returns of +20.56 percent during October 2011. Since then—aside from a marked dip lasting from late 2014 into early 2016—the correlation has declined only moderately. As of September 2017, it was 55 percent, which is 19 percentage points lower than its maximum value but actually 4.3 percentage points higher than its average value of 50.2 percent during the full 1995-2017 period.
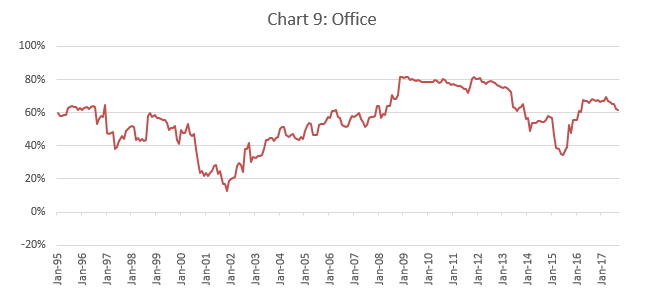
Office
Chart 9 shows the REIT-stock correlation for REITs in the office sector. The pattern is similar to what we observed for apartment REITs and industrial REITs: The maximum value of 81.8 percent occurred during the Great Financial Crisis, but that was nearly surpassed when it reached 81.5 percent as a result of office REITs posting a total return of 11.28 percent during October 2011. Since then, the correlation went through an Industrial-like dip during 2015, but otherwise has remained relatively high (by REIT standards): As of September 2017, it was 62 percent, which is 20 percentage points below its peak value but 5.6 percentage points higher than its average value of 56.0 percent.
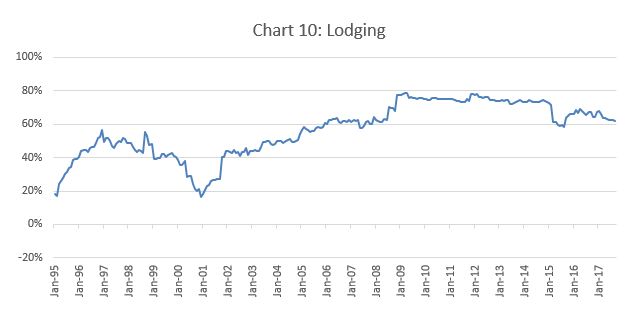
Lodging/Resort
Finally, Chart 10 shows the correlation between the broad stock market and REITs in the lodging/resort sector. This sector looks a little different from the rest of the REIT industry, as virtually the entire period since the onset of the Great Financial Crisis has seen REIT-stock correlations greater than we saw at any time before the GFC. The peak correlation of 79 percent occurred during early 2009, even though lodging REITs scored an industry-leading and truly spectacular total return of +26.02 percent during October 2011. Aside from a short 2015 dip reminiscent of the partment, industrial and office sectors, the correlation between lodging REITs and stocks has declined only moderately since then: As of September 2017, it was 62 percent (tied with office REITs for highest in the industry), which is 17 percentage points less than its peak value but 5.4 percentage points higher than its average value of 56.6 percent during the available historical period.
So there you have it. Many investors (including me) will get their exposure to the real estate asset class through a mutual fund or ETF that focuses on REITs broadly, and for those investors, the correlation between the broad REIT market and the broad stock market will be more relevant than the REIT-stock correlations for individual REIT sectors and subsectors. Others, though, will carefully determine how much of their total portfolio to invest in particular segments of the real estate asset class. For those investors—and, of course, for the investment managers and investment consultants who may advise them—I hope these results will be useful. If you have any comments or questions, please drop me a note at bcase@nareit.com.
Technical note: I estimate correlations using a Dynamic Conditional Correlation – Generalized Autoregressive Conditional Heteroskedasticity (DCC-GARCH) model, which is considered pretty much the state of the art for analyzing how correlations change over time. I use the Russell 3000 to measure total returns for the broad U.S. stock market, and the FTSE NAREIT index series for the REIT market. I update these estimates every month, so let me know if you want the latest.