Study Highlights
- REITs, on average, outperformed private real estate in defined benefit plans by nearly 2%.
- REITs, on average, outperformed most styles of private real estate.
- REITs and private real estate total returns were highly correlated after adjusting for reporting lags and both had similar correlations with other asset classes.
- REITs had the fourth highest average annual return of the 12 asset classes covered.
About the Study
CEM Benchmarking’s 2026 study (PDF), sponsored by Nareit, provides a comprehensive look at realized investment performance across asset classes over a 26-year period (1998–2023) using a unique dataset covering 462 public and private sector pensions. In 2023, the dataset included 135 plans representing more than $3.8 trillion in combined assets under management. One of the unique benefits of the CEM dataset is that it provides the actual realized performance of the assets chosen by plan managers and trustees.
Returns
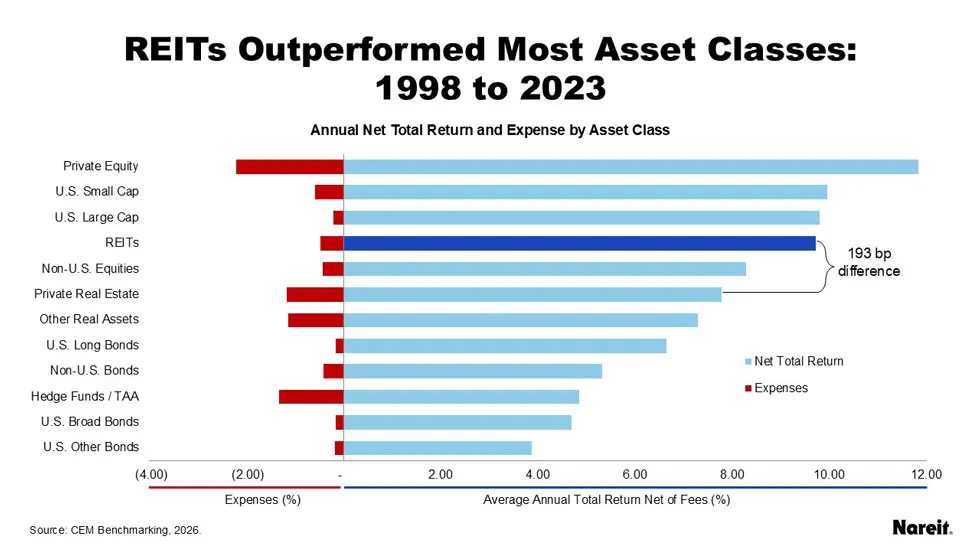
There are striking differences in performance across asset classes over the 26-year period covered by the study. The figure below summarizes average annual net returns and expenses for 12 asset classes.
- Private real estate produced average net returns of 7.79% over the period, almost 200 basis points less than REITs.
- Listed equity REITs had the fourth highest average annual net return over the period, 9.72%.
- The three worst performing asset classes were hedge funds/tactical asset allocation (TAA) strategies, U.S. broad bonds, and U.S. other fixed income. The last two categories, however, included significant cash holdings
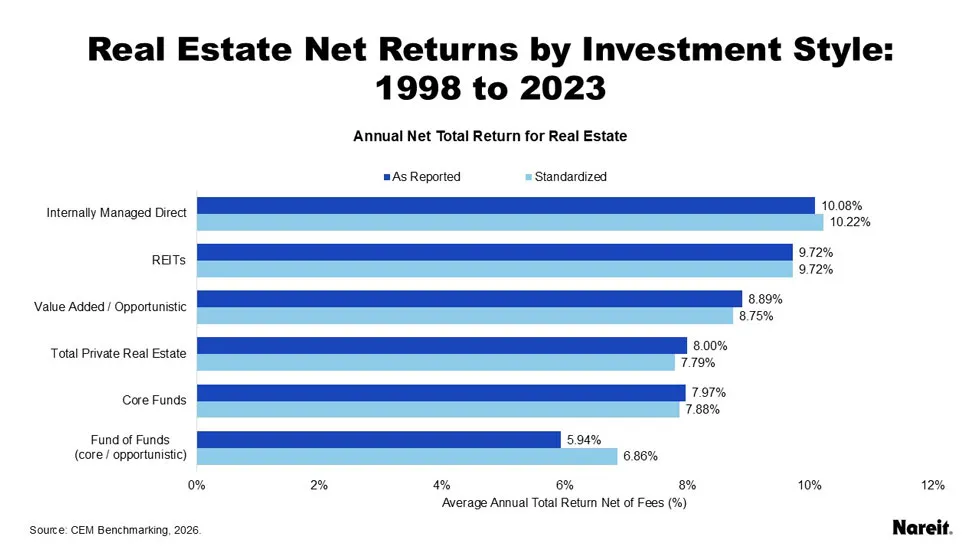
Real Estate Returns by Investment Style
Unlisted or private real estate can be accessed through a number of different investment styles, each with different risk profiles and costs. CEM provides comparisons of returns, correlations, and volatilities for total private real estate and each of the four key private real estate ownership styles:
- Internally managed direct
- Core funds
- Value added / opportunistic funds
- Fund of funds
The figure below shows as reported and standardized average annual net total returns for real estate. On average, both performance measures were very similar for each cohort.
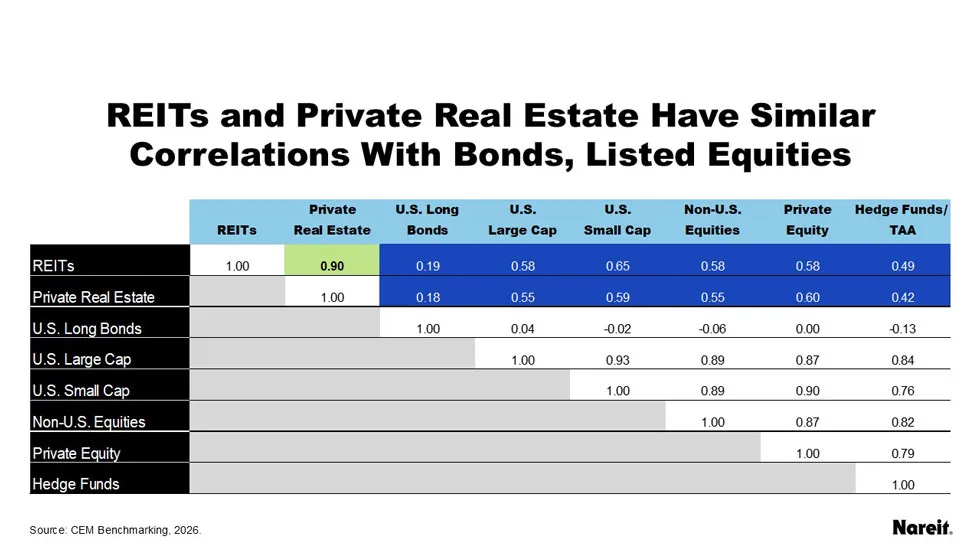
Correlations
The study computed correlations of annual returns among the 12 asset classes. The correlation table below summarizes some key correlations between broad equities, REITs, and private real estate.
As highlighted in green, REIT and private real estate returns were highly correlated when illiquid returns were adjusted for reporting lags. The correlation was measured as 0.90. The high correlation between them was not surprising given the similarities in their underlying assets.
As highlighted in dark blue, REIT and private real estate returns had similar correlations with bond and equity returns. These correlations reflect the well-known diversification benefits associated with the real estate asset class, whether REITs or private real estate.
Volatilities and Risk Adjusted Returns
The study also compared volatilities and risk adjusted returns using the Sharpe ratio across asset classes.
The data are summarized below.
- REITs had a high Sharpe ratio measuring 0.39, a level similar to private equity, U.S. large and small caps, and U.S. long bonds. Private real estate had a lower Sharpe ratio measuring 0.33.
- After adjusting for valuation lags, REITs and private real estate had comparable volatilities. REITs and private real estate had measured volatilities of 19.08% and 16.98%, respectively. As with correlations, the similarity in risk was not surprising given that REITs and unlisted real estate invest in similar underlying assets.
- After adjusting for valuation lags, private equity was the most volatile asset class.

Conclusion
The CEM analysis concluded that over the 26-year period of study covering the years 1998 through 2023, REITs, on average, outperformed private real estate by nearly 2%. The study also found that REITs outperform private real estate in all ownership style excluding internally managed direct.