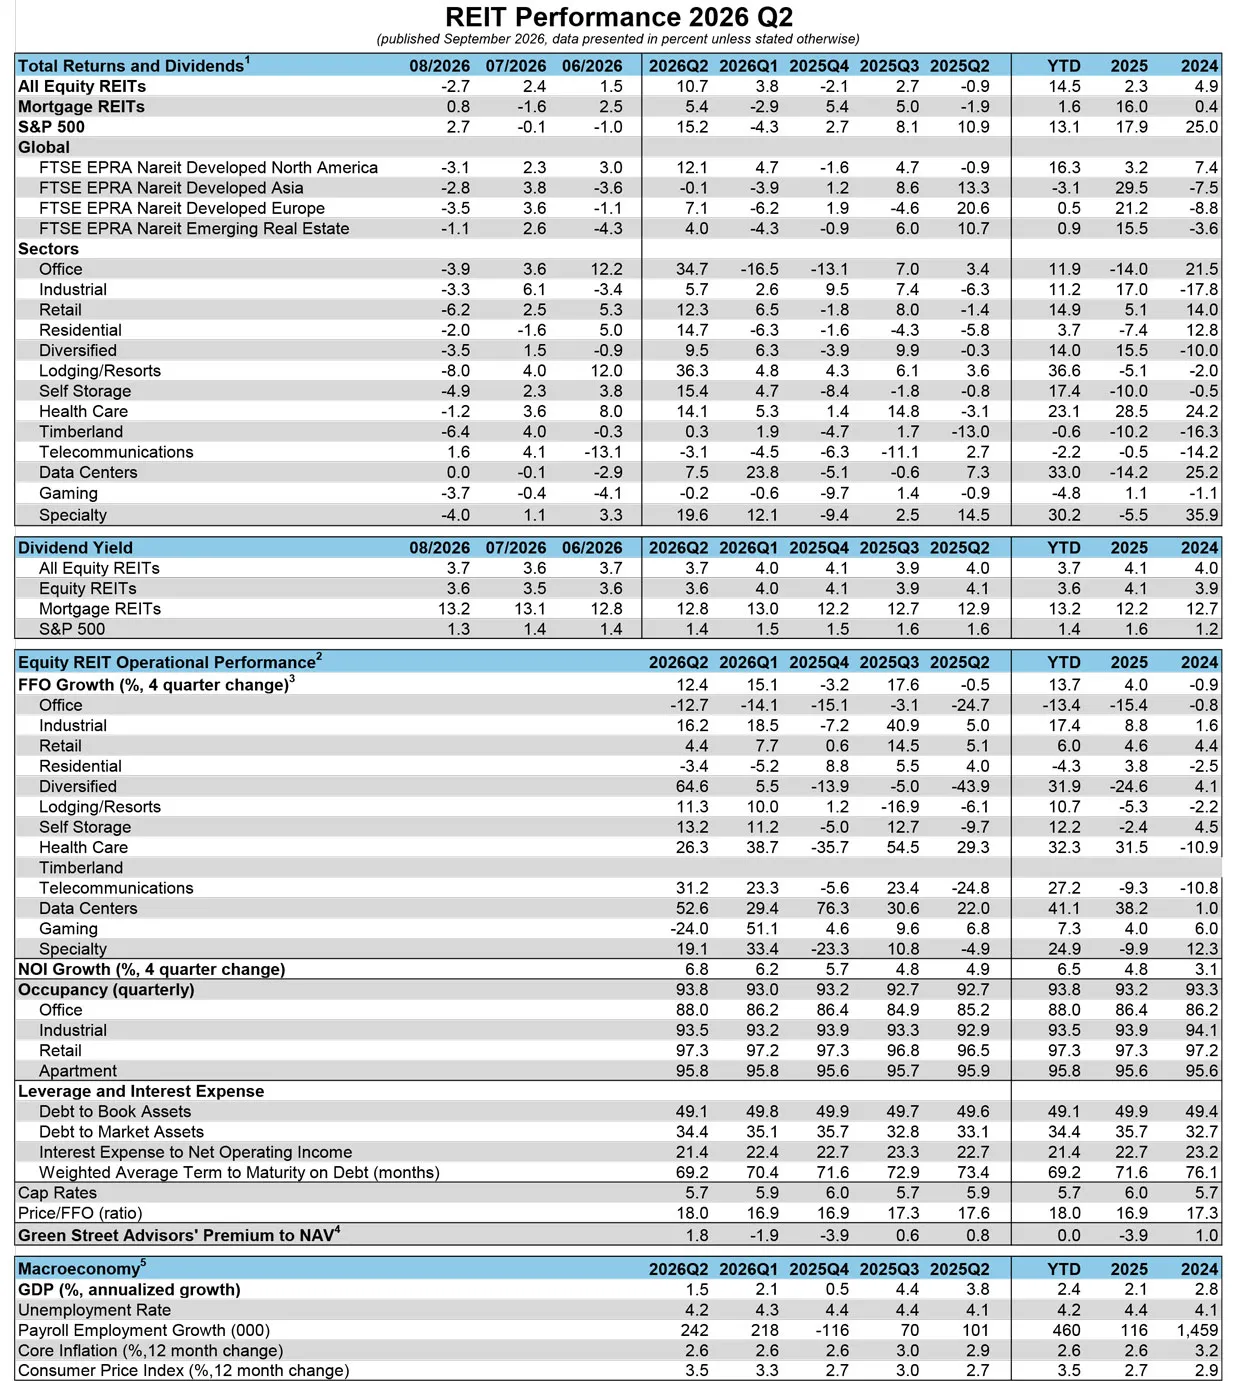
Nareit's Quarterly REIT Performance Data provides a clear picture of REIT returns and operating performance in a downloadable, easy-to-read format. Stay up to date on REIT and macroeconomic fundamentals with a printable PDF containing data on REIT total returns, FFO growth, leverage, and more.
The 2026 returns have demonstrated strong equity REIT performance, with year-to-date (YTD) total returns of 11.6% for the FTSE Nareit All Equity Index as of September 21, 2026. Mortgage REITs have posted a loss of 5.0%, with home financing mREITs recording a narrow YTD loss of 0.9% and commercial mREITs a YTD loss of 17.0%. Global REIT returns remained positive, with the FTSE EPRA Nareit Developed Index returning 6.4%. REITs continue to provide attractive dividends; equity and mortgage REITs offered YTD dividends of 3.8% and 14.1%, respectively.
Get quarterly REIT performance data and the latest REIT-related research sent to your inbox. Subscribe to Nareit Research.
Footnotes:
1Source: FactSet, FTSE Nareit US, FTSE EPRA/Nareit Global; YTD Data as of August 31, 2026.
2Source: Nareit REIT Industry Tracker. Operational Performance is dollar weighted from the FTSE Nareit All Equity REITs index; YTD Data as of Q2:2026.
3YTD % change
4Source: Green Street Advisors All REIT Premium to NAV; YTD data as of August 31, 2026.
5Source: Bureau of Economic Analysis GDP report and Bureau of Labor Statistics Employment and CPI reports; YTD Data as of Q2:2026.