Nareit’s REIT Industry Tracker Series – formerly the Nareit T-Tracker– is the first quarterly performance measurement of the U.S. listed REIT industry. The series includes three key REIT industry measures: funds from operations, net operating income, and the dividends that equity and mortgage REITs pay to their shareholders.
Key Takeaways for REIT Industry Tracker Q1:2026
14.8%
YOY FFO growth
35.4%
Leverage ratio
5.9%
REIT implied cap rate
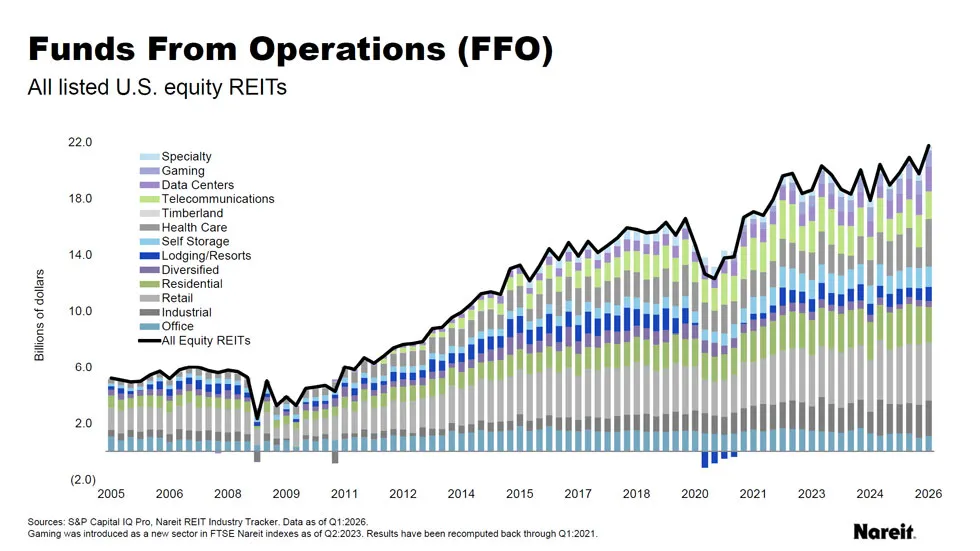
- 65% of REITs reported year-over-year increases in increases in Funds from Operations (FFO), with FFO increasing 14.8% from one year ago
- Over 75% of REITs reported year-over-year increases in Net Operating Income (NOI), with NOI increasing 5.6% from one year ago
- Same Store NOI experienced 3.8% year-over-year gain
- Occupancy for All Equity REITs was at 93.2%
- Leverage ratios remained low with debt-to-market assets at 35.4%
- Weighted average term to maturity of REIT debt was 5.9 years
- Weighted average interest rate on total debt was 4.1%
- 89.3% of total debt was at a fixed rate
- 82.5% of REITs’ total debt was unsecured
- REIT implied cap rate was 5.9%
- Gross acquisitions totaled $12.1 billion
- Dispositions totaled $8.0 billion
- Net acquisitions totaled $4.2 billion
Image