Economic Update (March 4, 2014)
Bank lending to CRE picks up as commercial property sales, prices recover.
An upswing in bank lending in the fourth quarter signals higher levels of activity across nonresidential real estate, multifamily residential and real estate construction and development.
Bank lending for real estate investment is closely related to trends in transactions and prices. Recently-released data from the FDIC on bank lending reveal increased lending for investment in nonresidential real estate, multifamily residences, and construction and development:
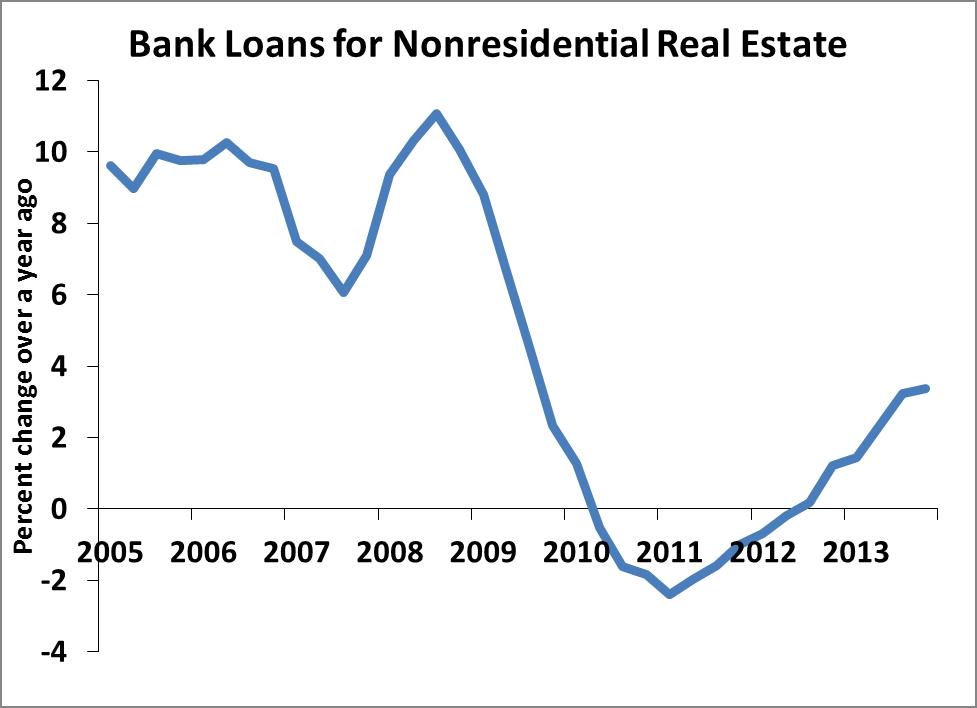
- Bank loans for nonresidential real estate accelerated to 6.4 percent annualized growth, the fastest since 2008 (Chart 1):
- Commercial property transactions have ramped up to a $30 billion monthly rate, ahead of the pace during 2005-6 but well below the market peak in 2007 (Chart 2):
![]()
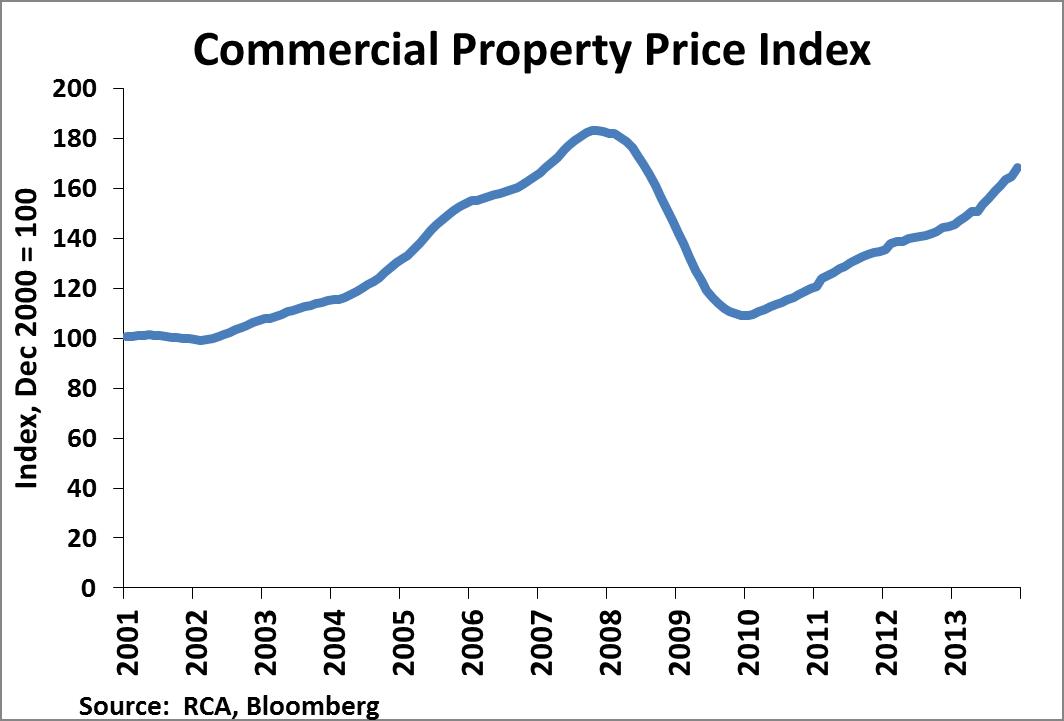
- Commercial property prices are approaching pre-recession levels (Chart 3):
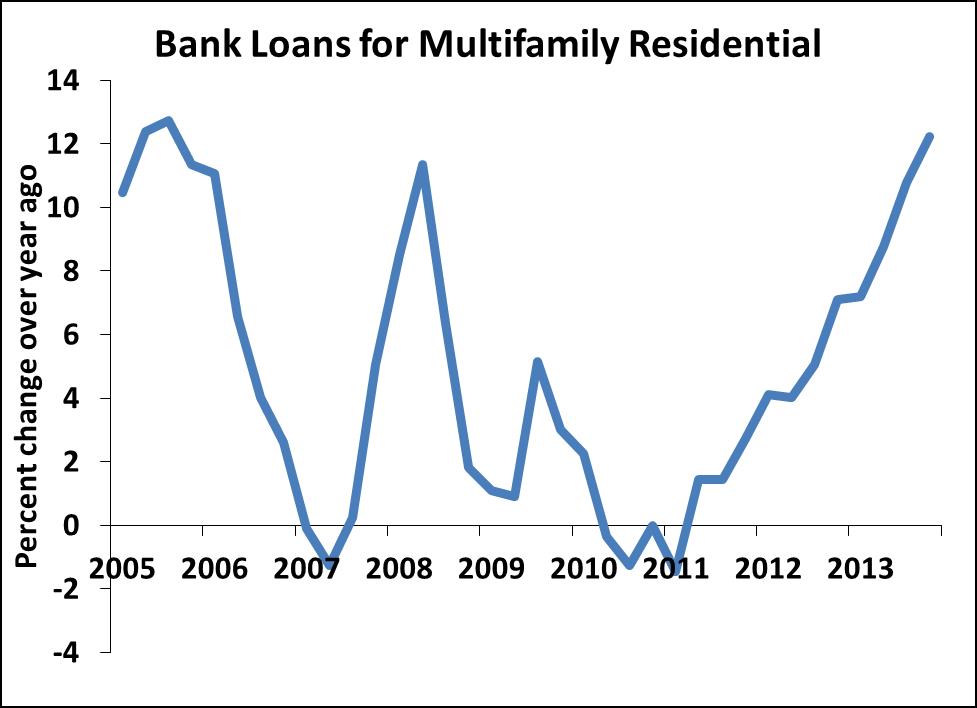
- Lending for multifamily residential real estate is rising as well, with growth in Q4 accelerating to a 17.5 percent annual rate (Chart 4):
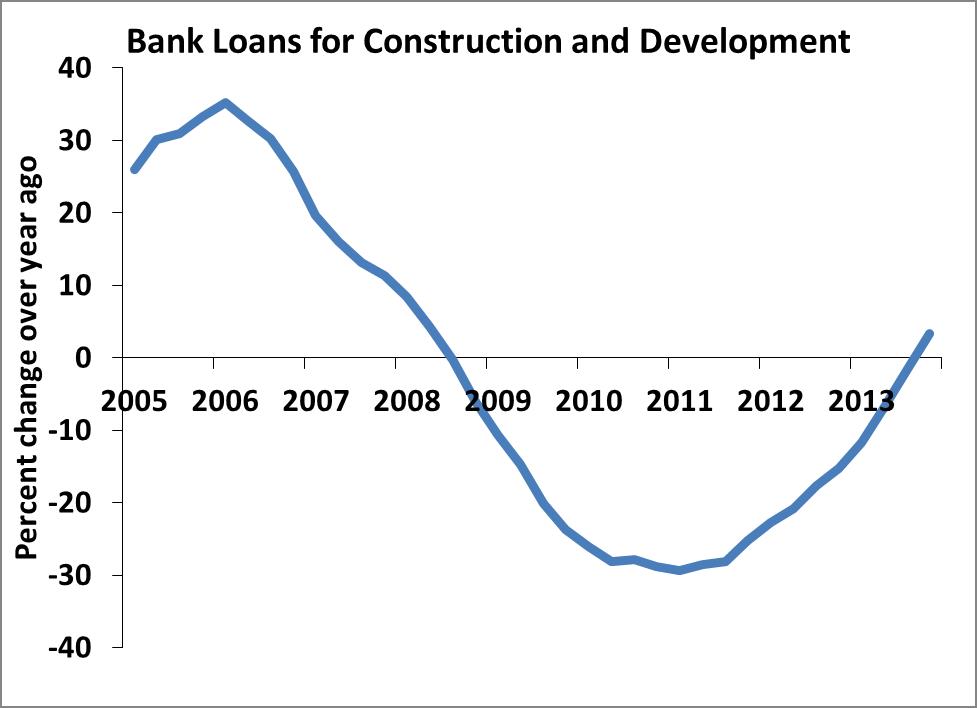
- Construction and development is responding to the increase in transactions and prices. Bank lending has turned up to a 7.8 percent annual growth rate (Chart 5):
Commercial Property Update 2013:Q4 (February 7, 2014)
Market conditions improved across all property types in the fourth quarter. Strong demand for apartments pushed absorption higher, although a pick-up in new supply tempered the decline in vacancy rates. Office rents increased, despite the slow decline in office vacancies. The retail sector posted modest improvements in vacancies and rents but is still lagging the other property sectors. Check the latest Commercial Property Update for details.
Economic Update (February 2, 2014)
Homeownership is stabilizing, but weak job market is still holding back both rental and ownership markets.
The home ownership rate held steady for the final three quarters of 2013 at 65.1 percent, after having declined a half-percentage point or more each year since its peak in the mid-2000s (Chart 1). This tentative stabilization suggests that housing markets may soon move beyond the mortgage crisis and back to a period of more normal recovery and growth.
Yet data on household formation show that the recovery is still being held back by the weak job market. Household formation, when one or more people move out of shared accommodations to buy or rent a place of their own, is the ultimate source of demand for both home ownership and rental apartments.
Household formation often falls in recessions but usually rebounds in economic recoveries. The current recovery, however, still shows no sign of rebound, as the rate of household formation over the past year has been stuck at 0.25 percent, well below the long term trend of 1.25 percent (Chart 2). Millions of unemployed or under-employed people are doubled-up with roommates or family members, and are waiting until the job market improves before they rent their own place.
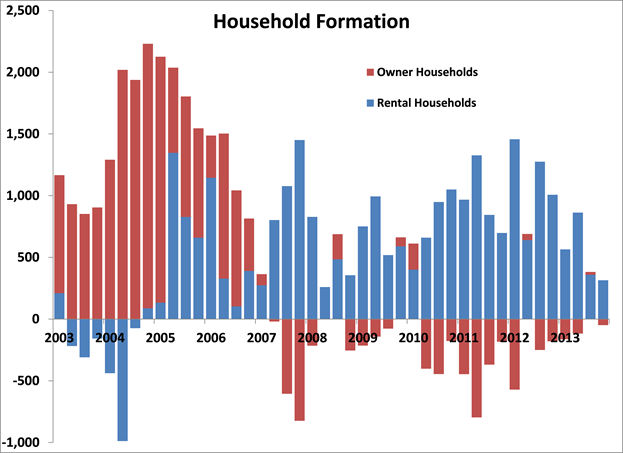
The limited number of new households that did form in 2013 moved into rental properties, as weak incomes, lack of money for a down payment and tight lending standards make it difficult for many of them to get a mortgage (Chart 3).
The anemic pace of household formation suggests that demand for housing (both rental and purchase) will remain subdued in the first half of 2014. If job growth accelerates, however, the pent-up demand of 3 million to 4 million “shadow households” could turn into an actual demand for purchase or rental. The additional demand for rentals from these “shadow households” will keep the demand for apartments tight even as the home sale market gets back to firing on all cylinders.
Chart 1
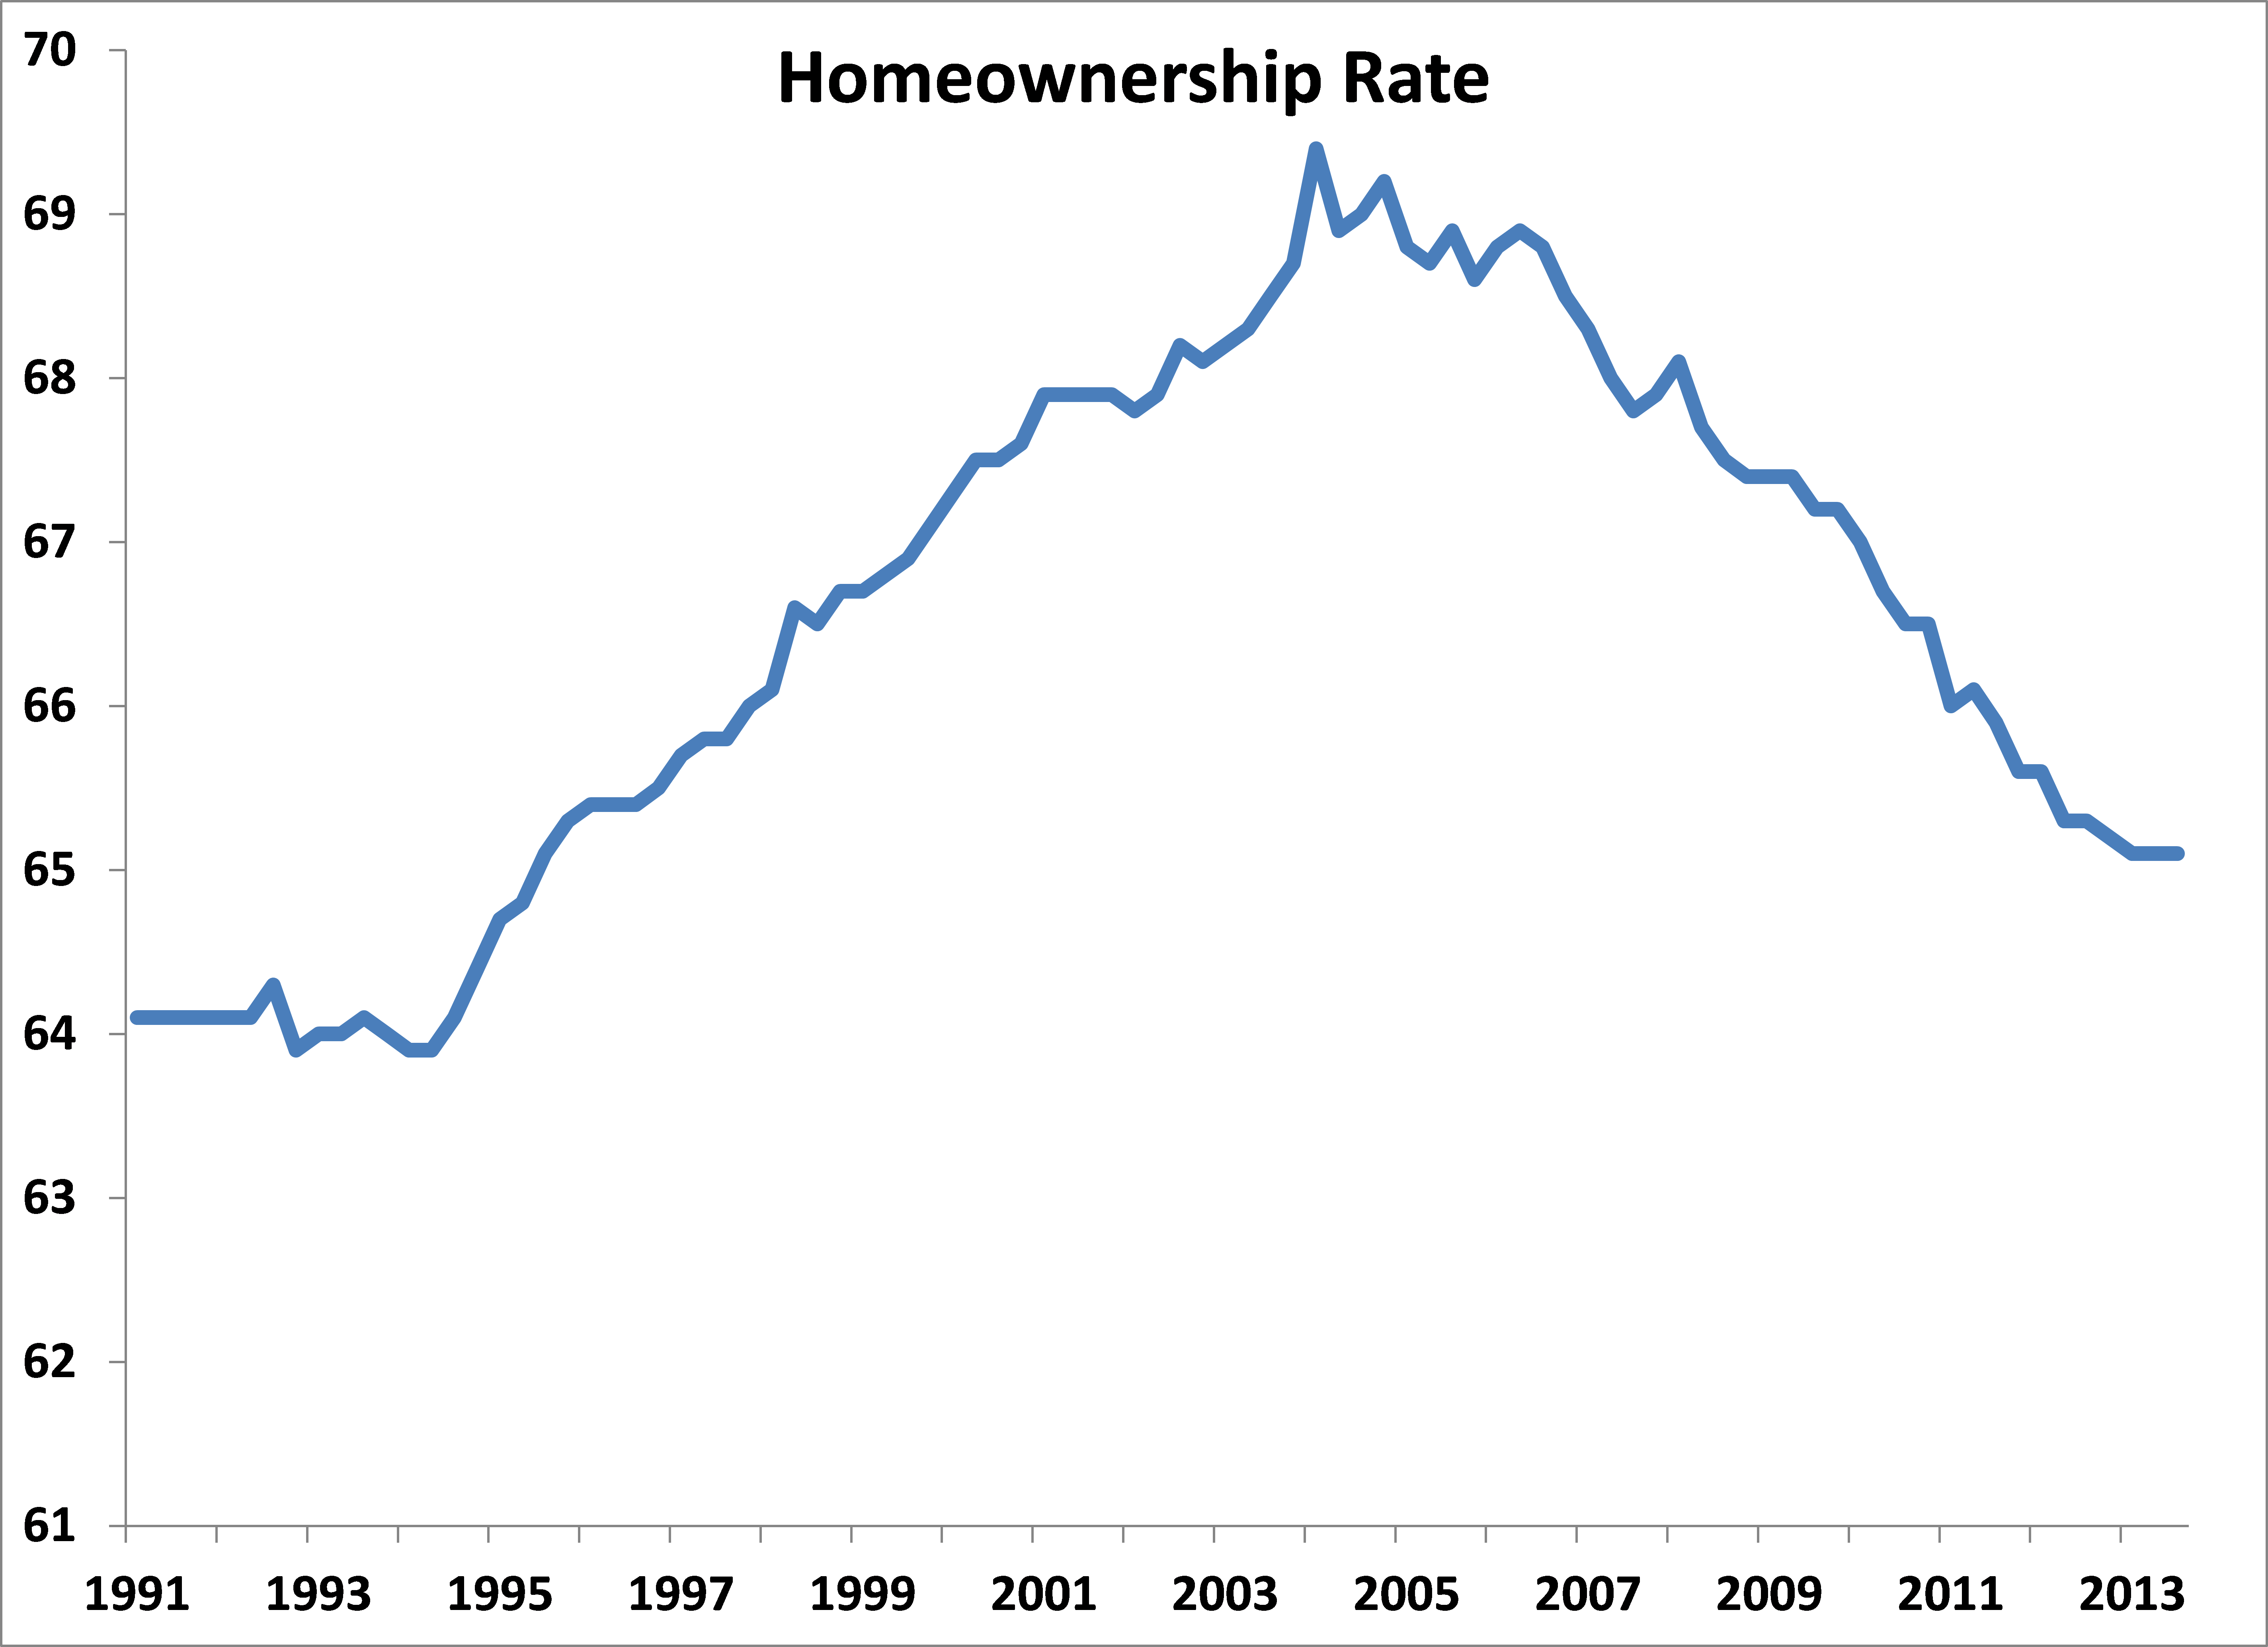
Chart 2
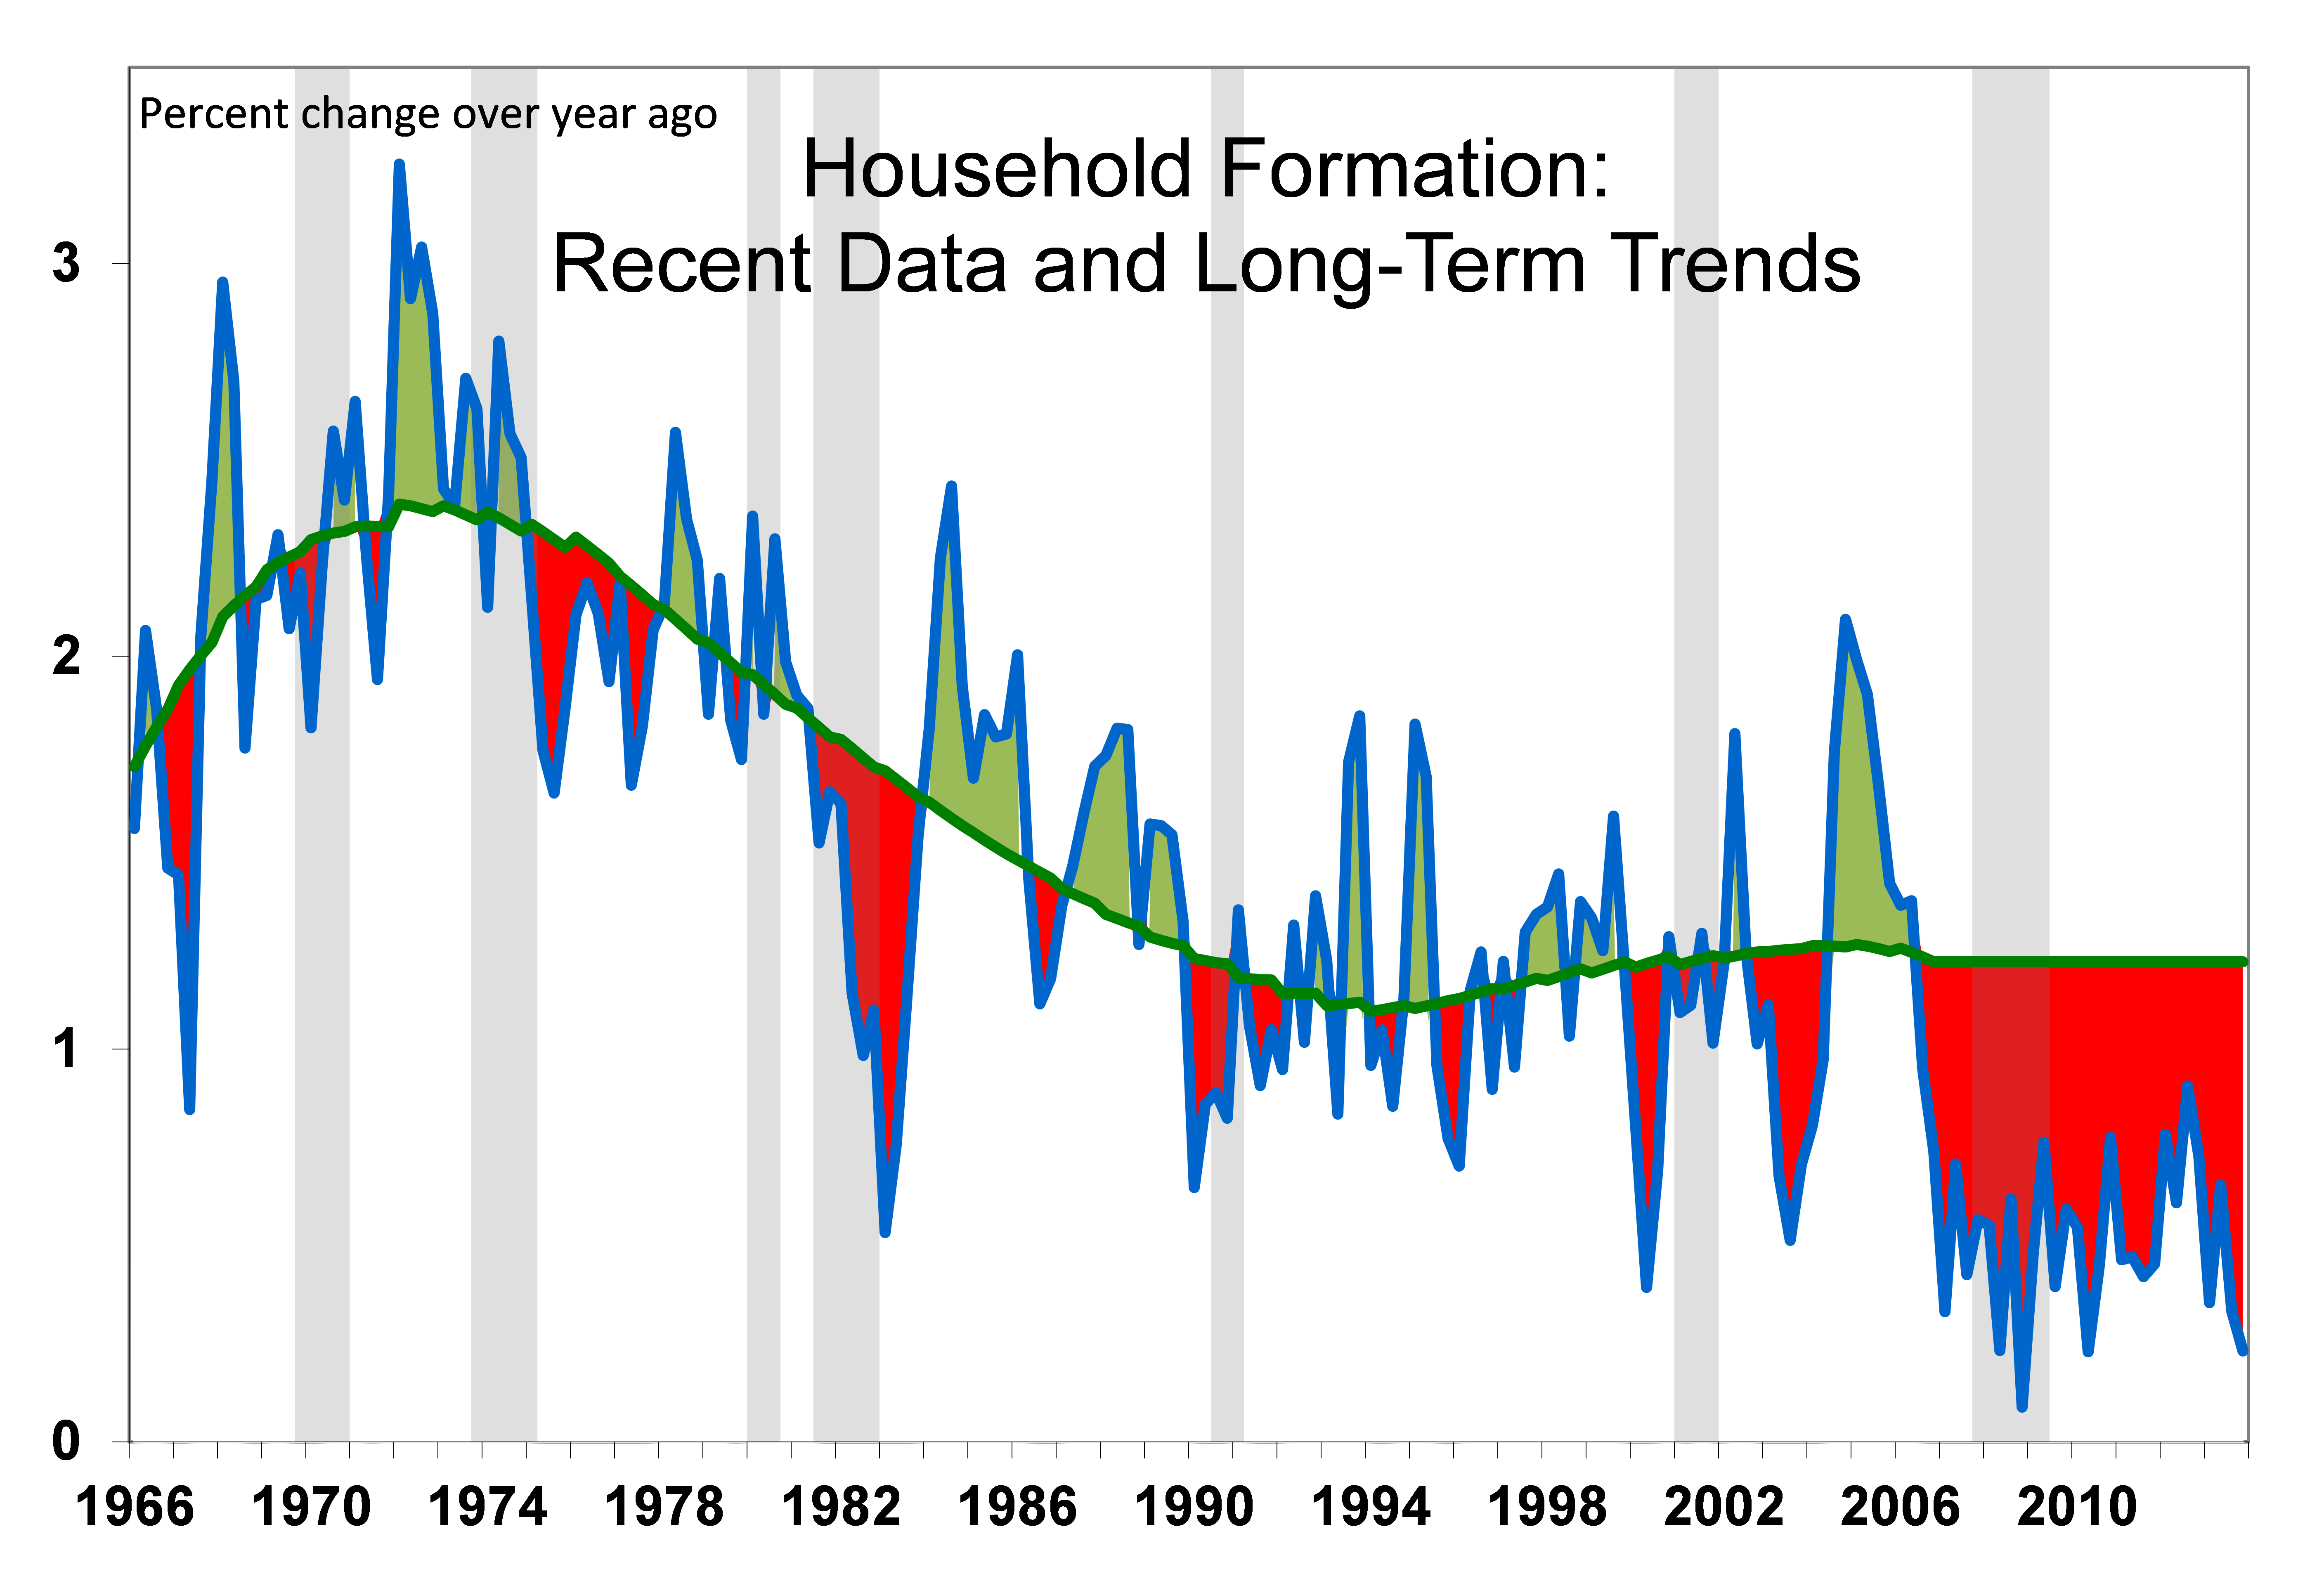
The current rate of household formation is shown in blue line; long-term trend shown in green line; “shadow demand” is the red area between the two. Shading shows economic recessions.
Chart 3
Economic Update (December 9, 2013)
Signs of financial healing in the third quarter
The economy showed more signs of financial healing in the third quarter, according to the Federal Reserve Board’s Flow of Funds Accounts:
- Commercial lending strengthened as transactions and prices picked up. Commercial mortgage net lending increased to nearly $80 billion annualized, the strongest since prior to the financial crisis (chart 1). Commercial banks provided $55 billion, roughly two-thirds of the total net lending. Life insurance companies increased their net position by the largest amount since the crisis, and net issuance of CMBS was positive for only the second time since 2007.
- Home mortgage net lending turned positive. Home mortgage net lending was positive for the first time since the financial crisis (chart 2). This reflects stronger gross originations as the housing market recovers, as well as a dwindling amount of write-offs from defaults and foreclosures.
- Household net worth rose by $1.9 trillion, to $77.3 trillion (chart 3). This is up nearly 40 percent from its trough during the crisis. Rising house prices contributed one-quarter of this increase, while equities—both direct stock holdings and indirect holdings through mutual funds and retirement accounts—accounted for 60 percent of the increase (chart 4).
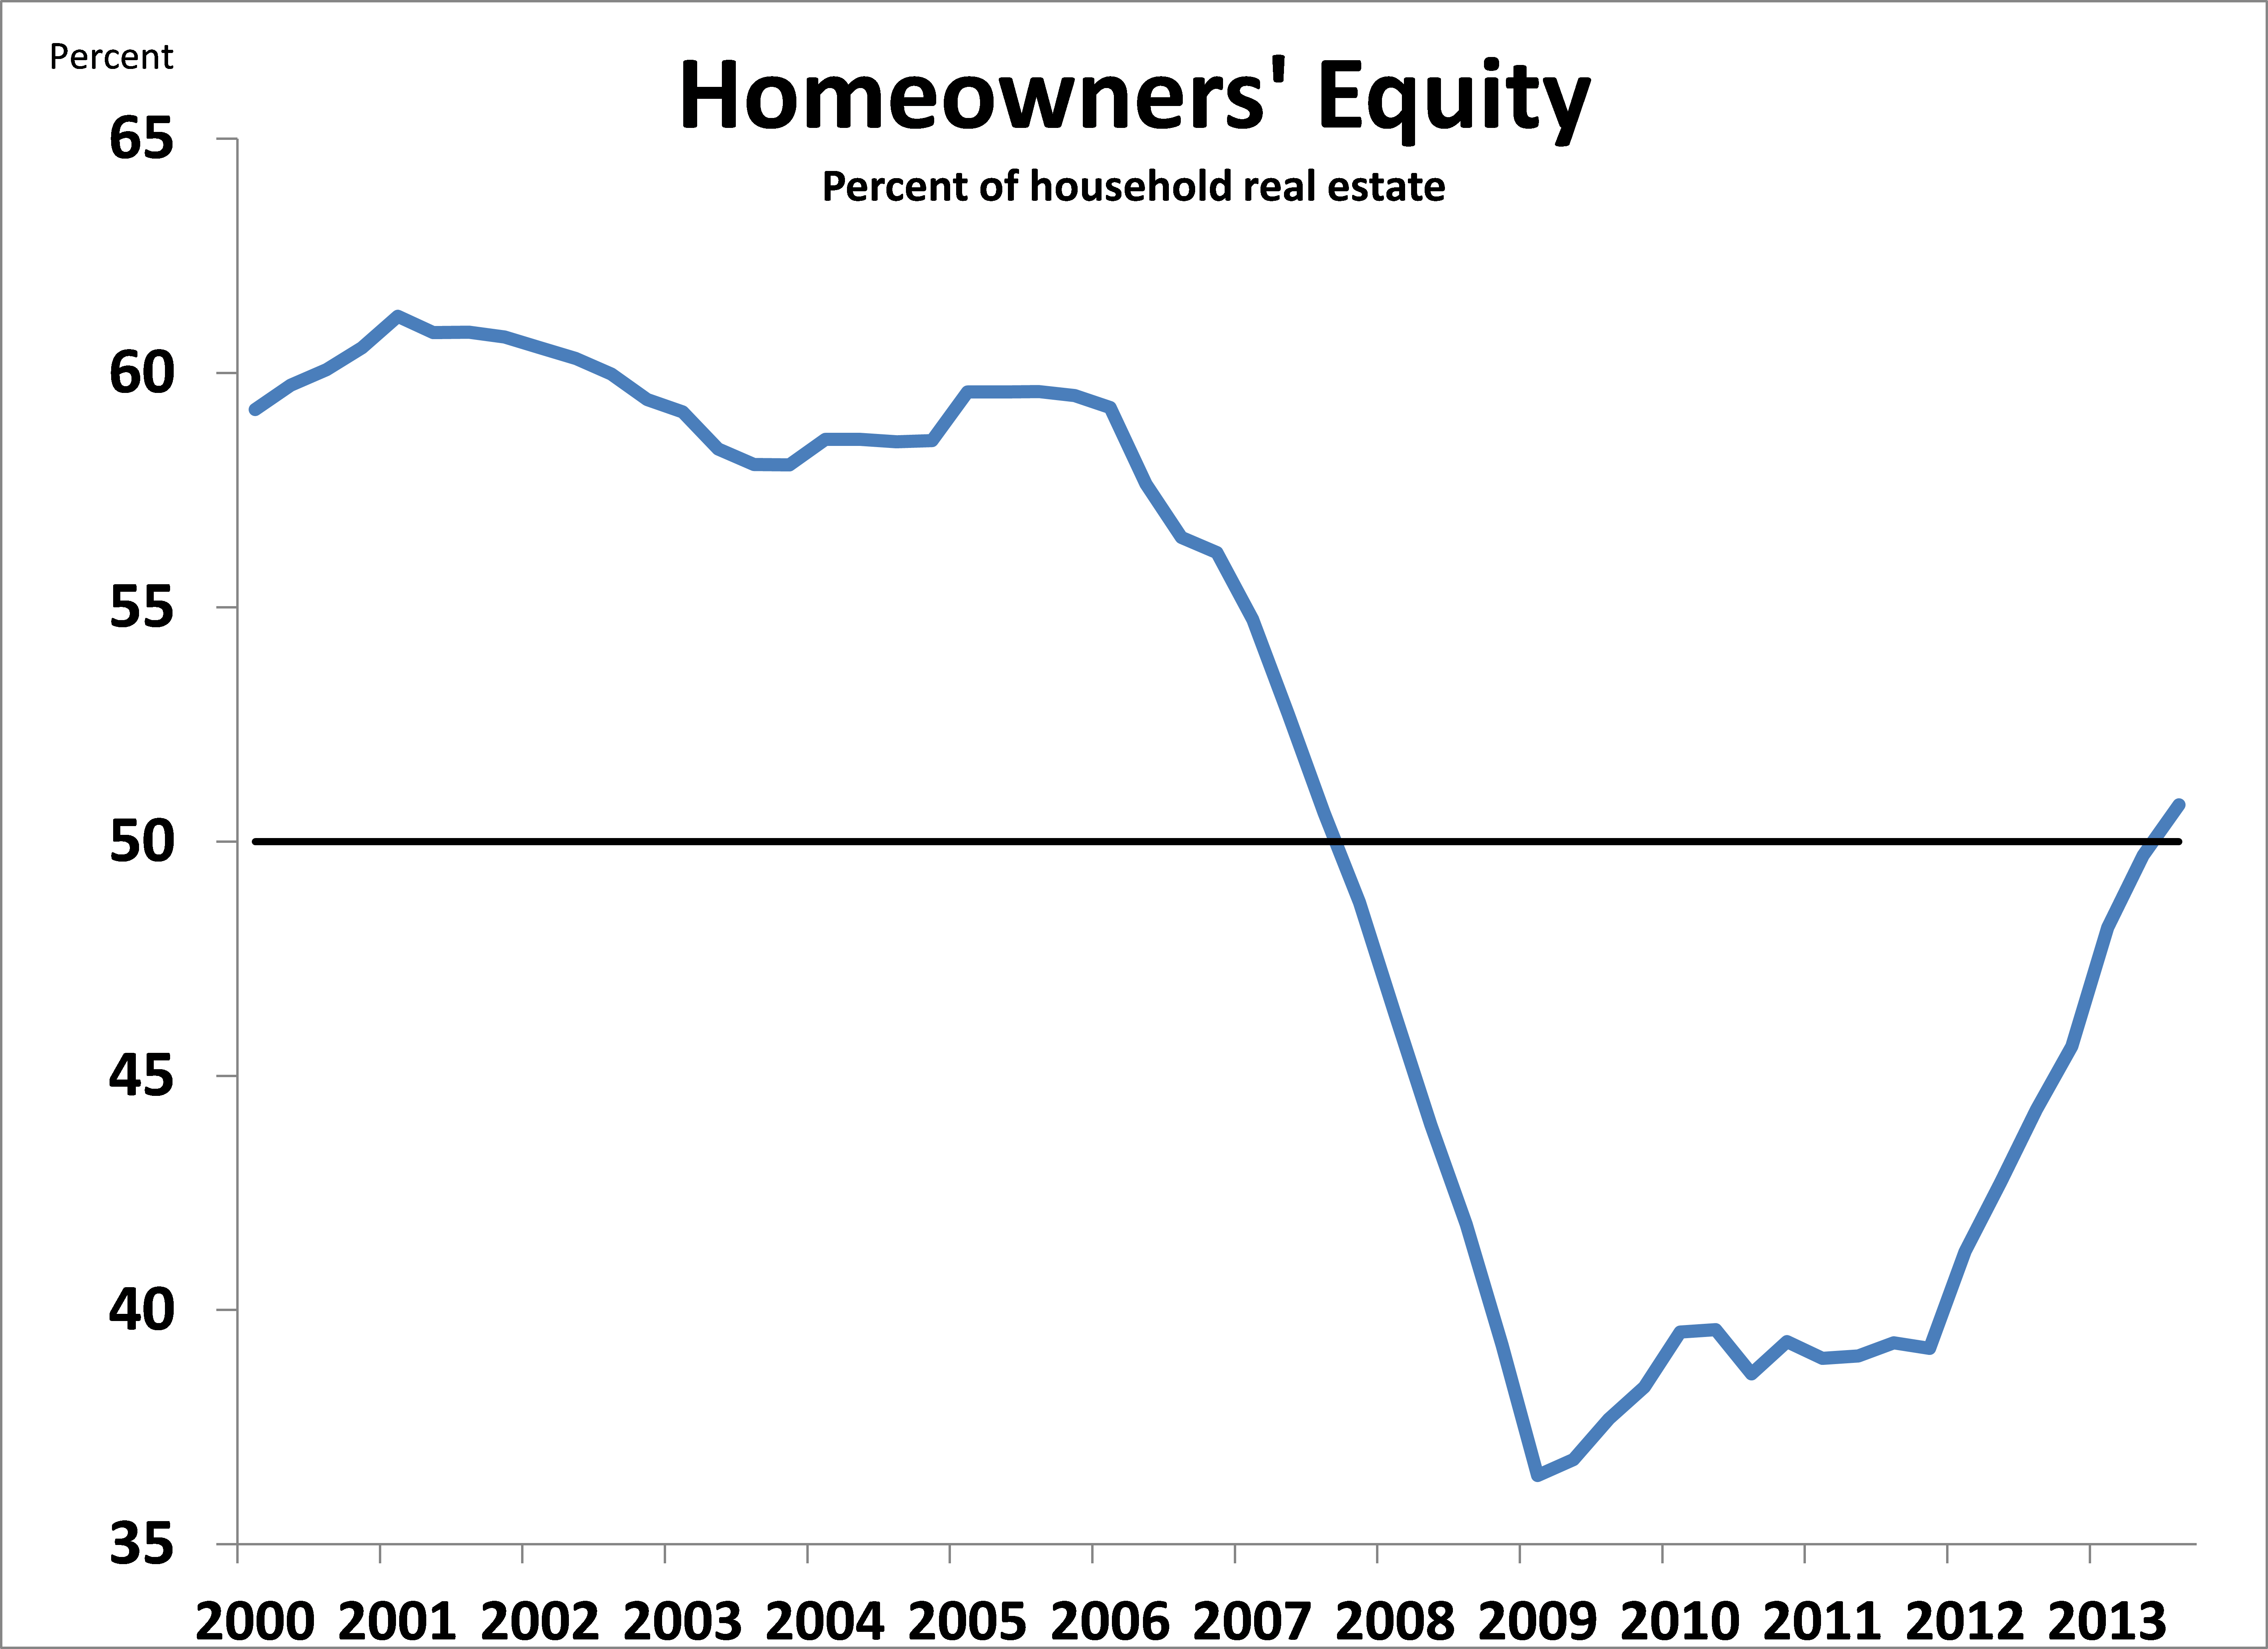
- Homeowners’ equity as a percentage of total real estate rose above 50 percent for the first time since 2007 (chart 5).
Chart 1
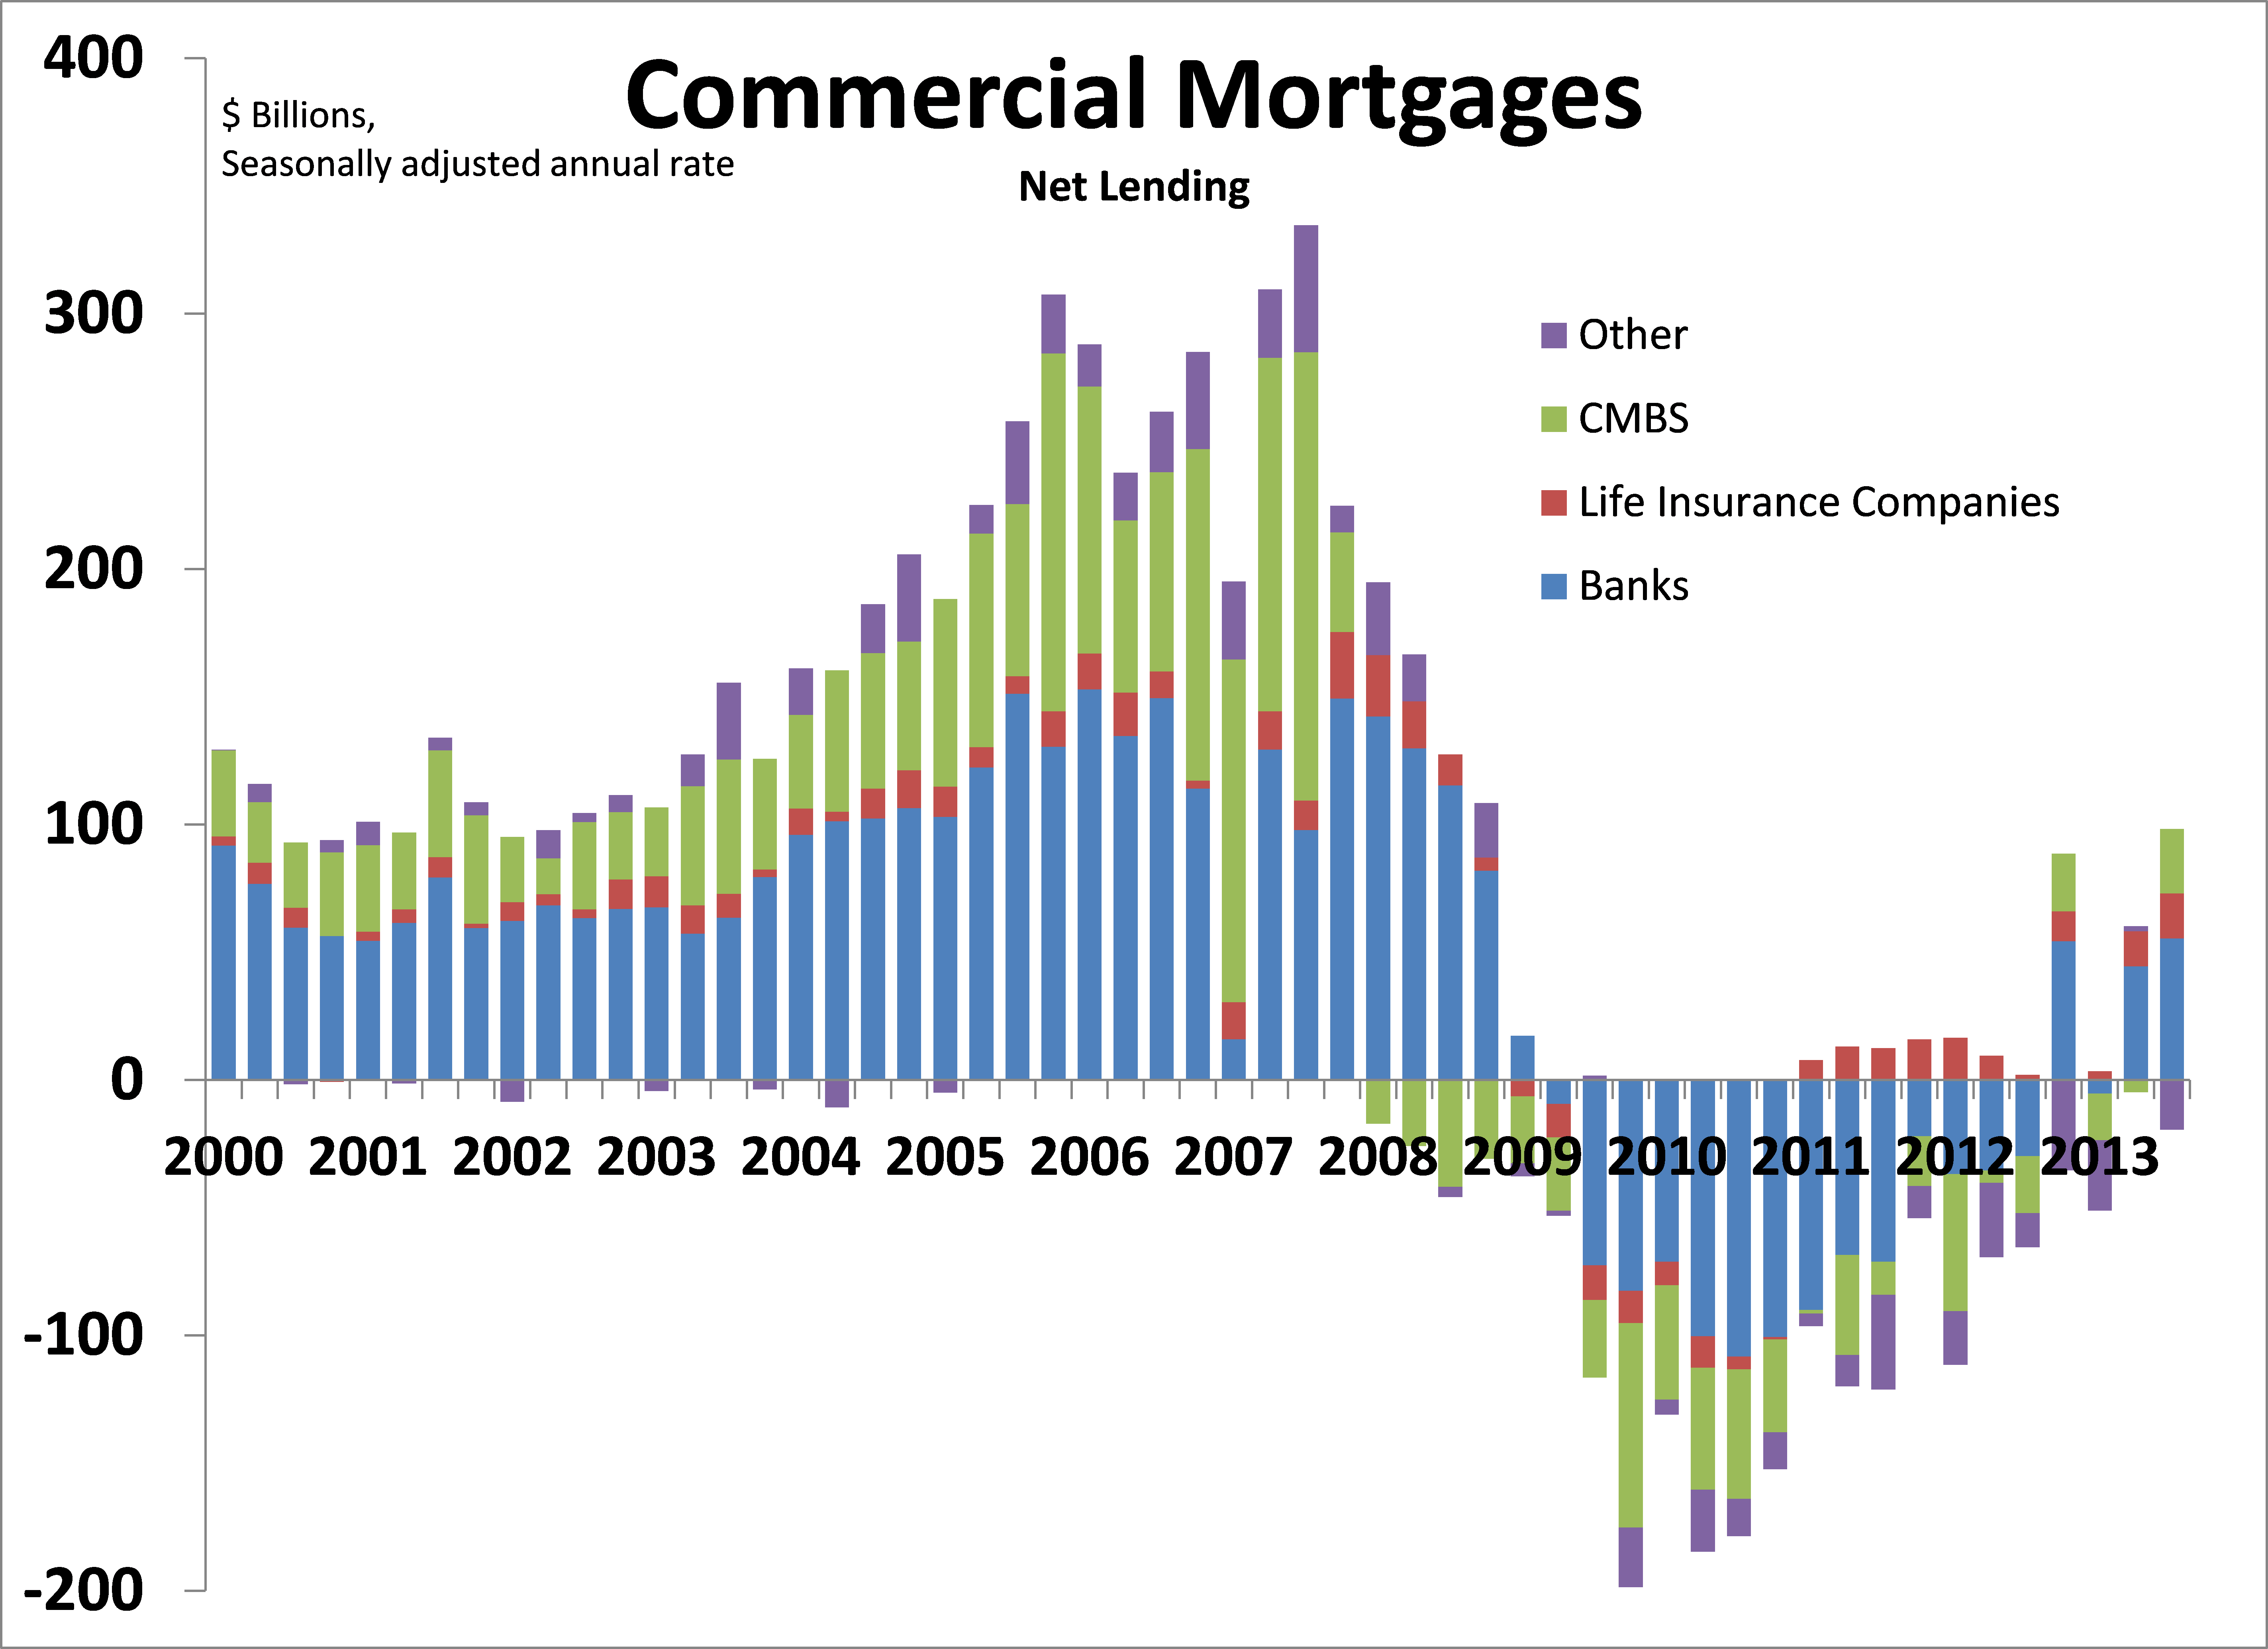
Chart 2
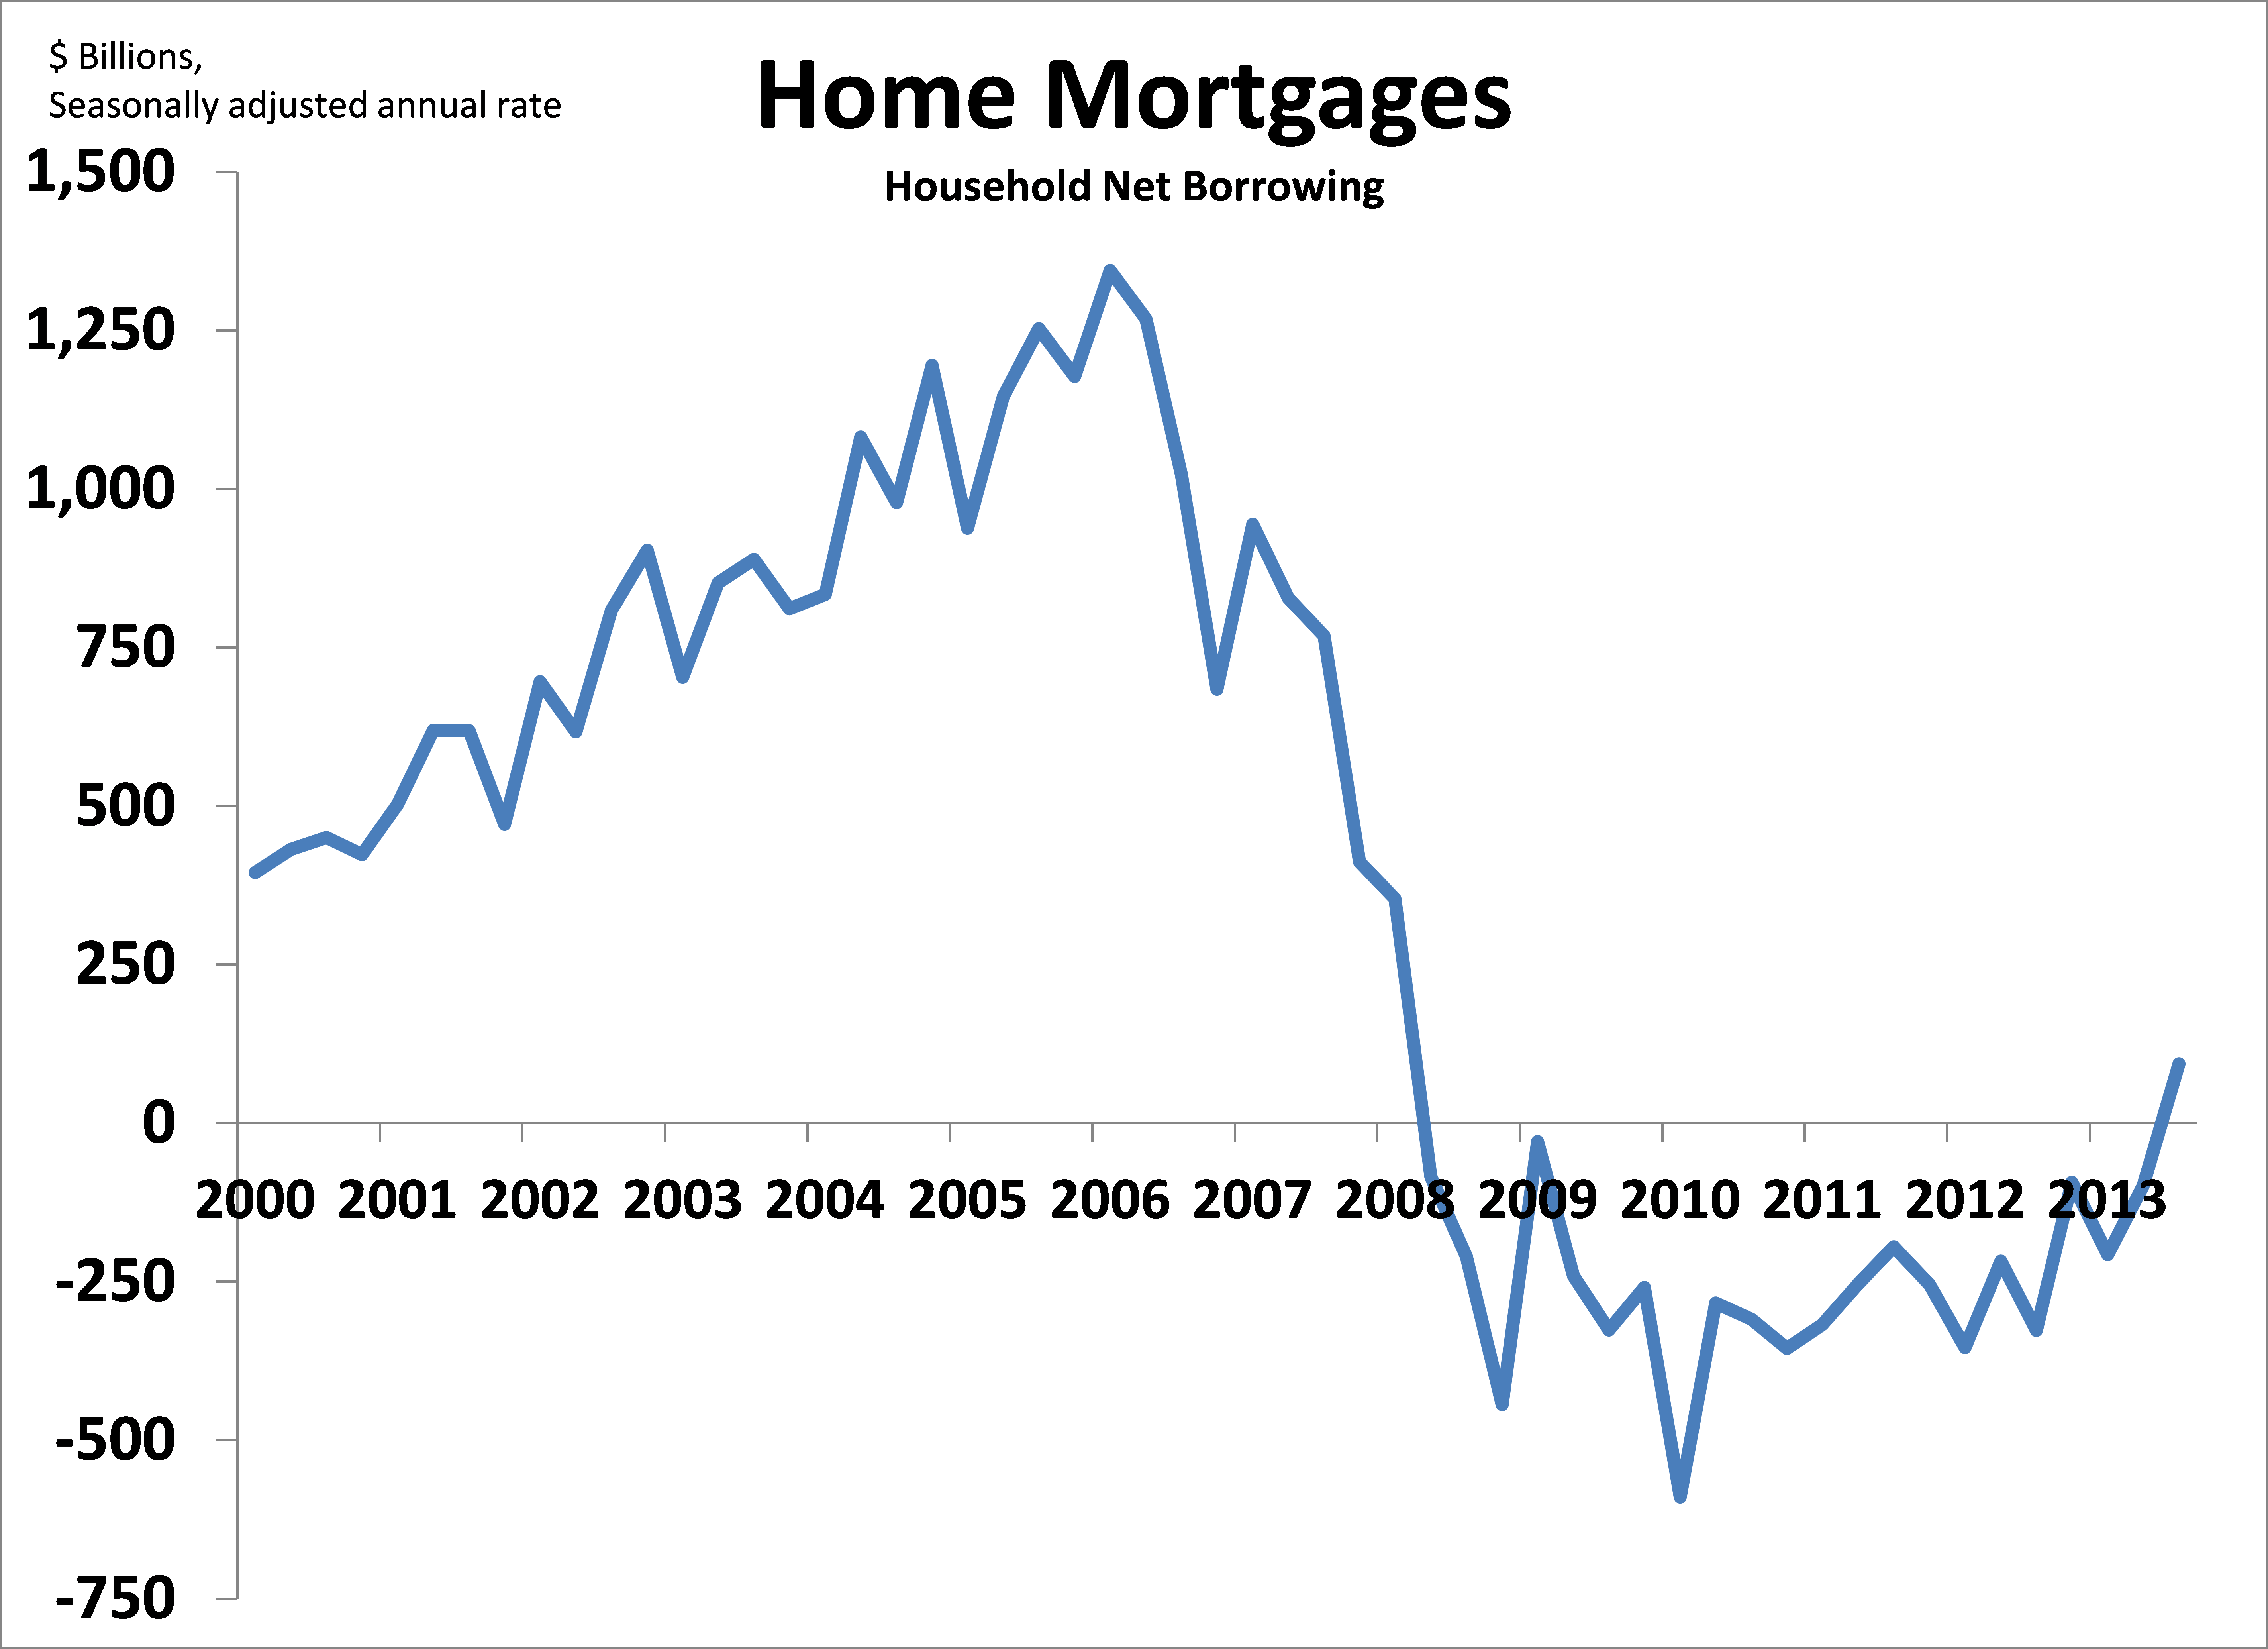
Chart 3
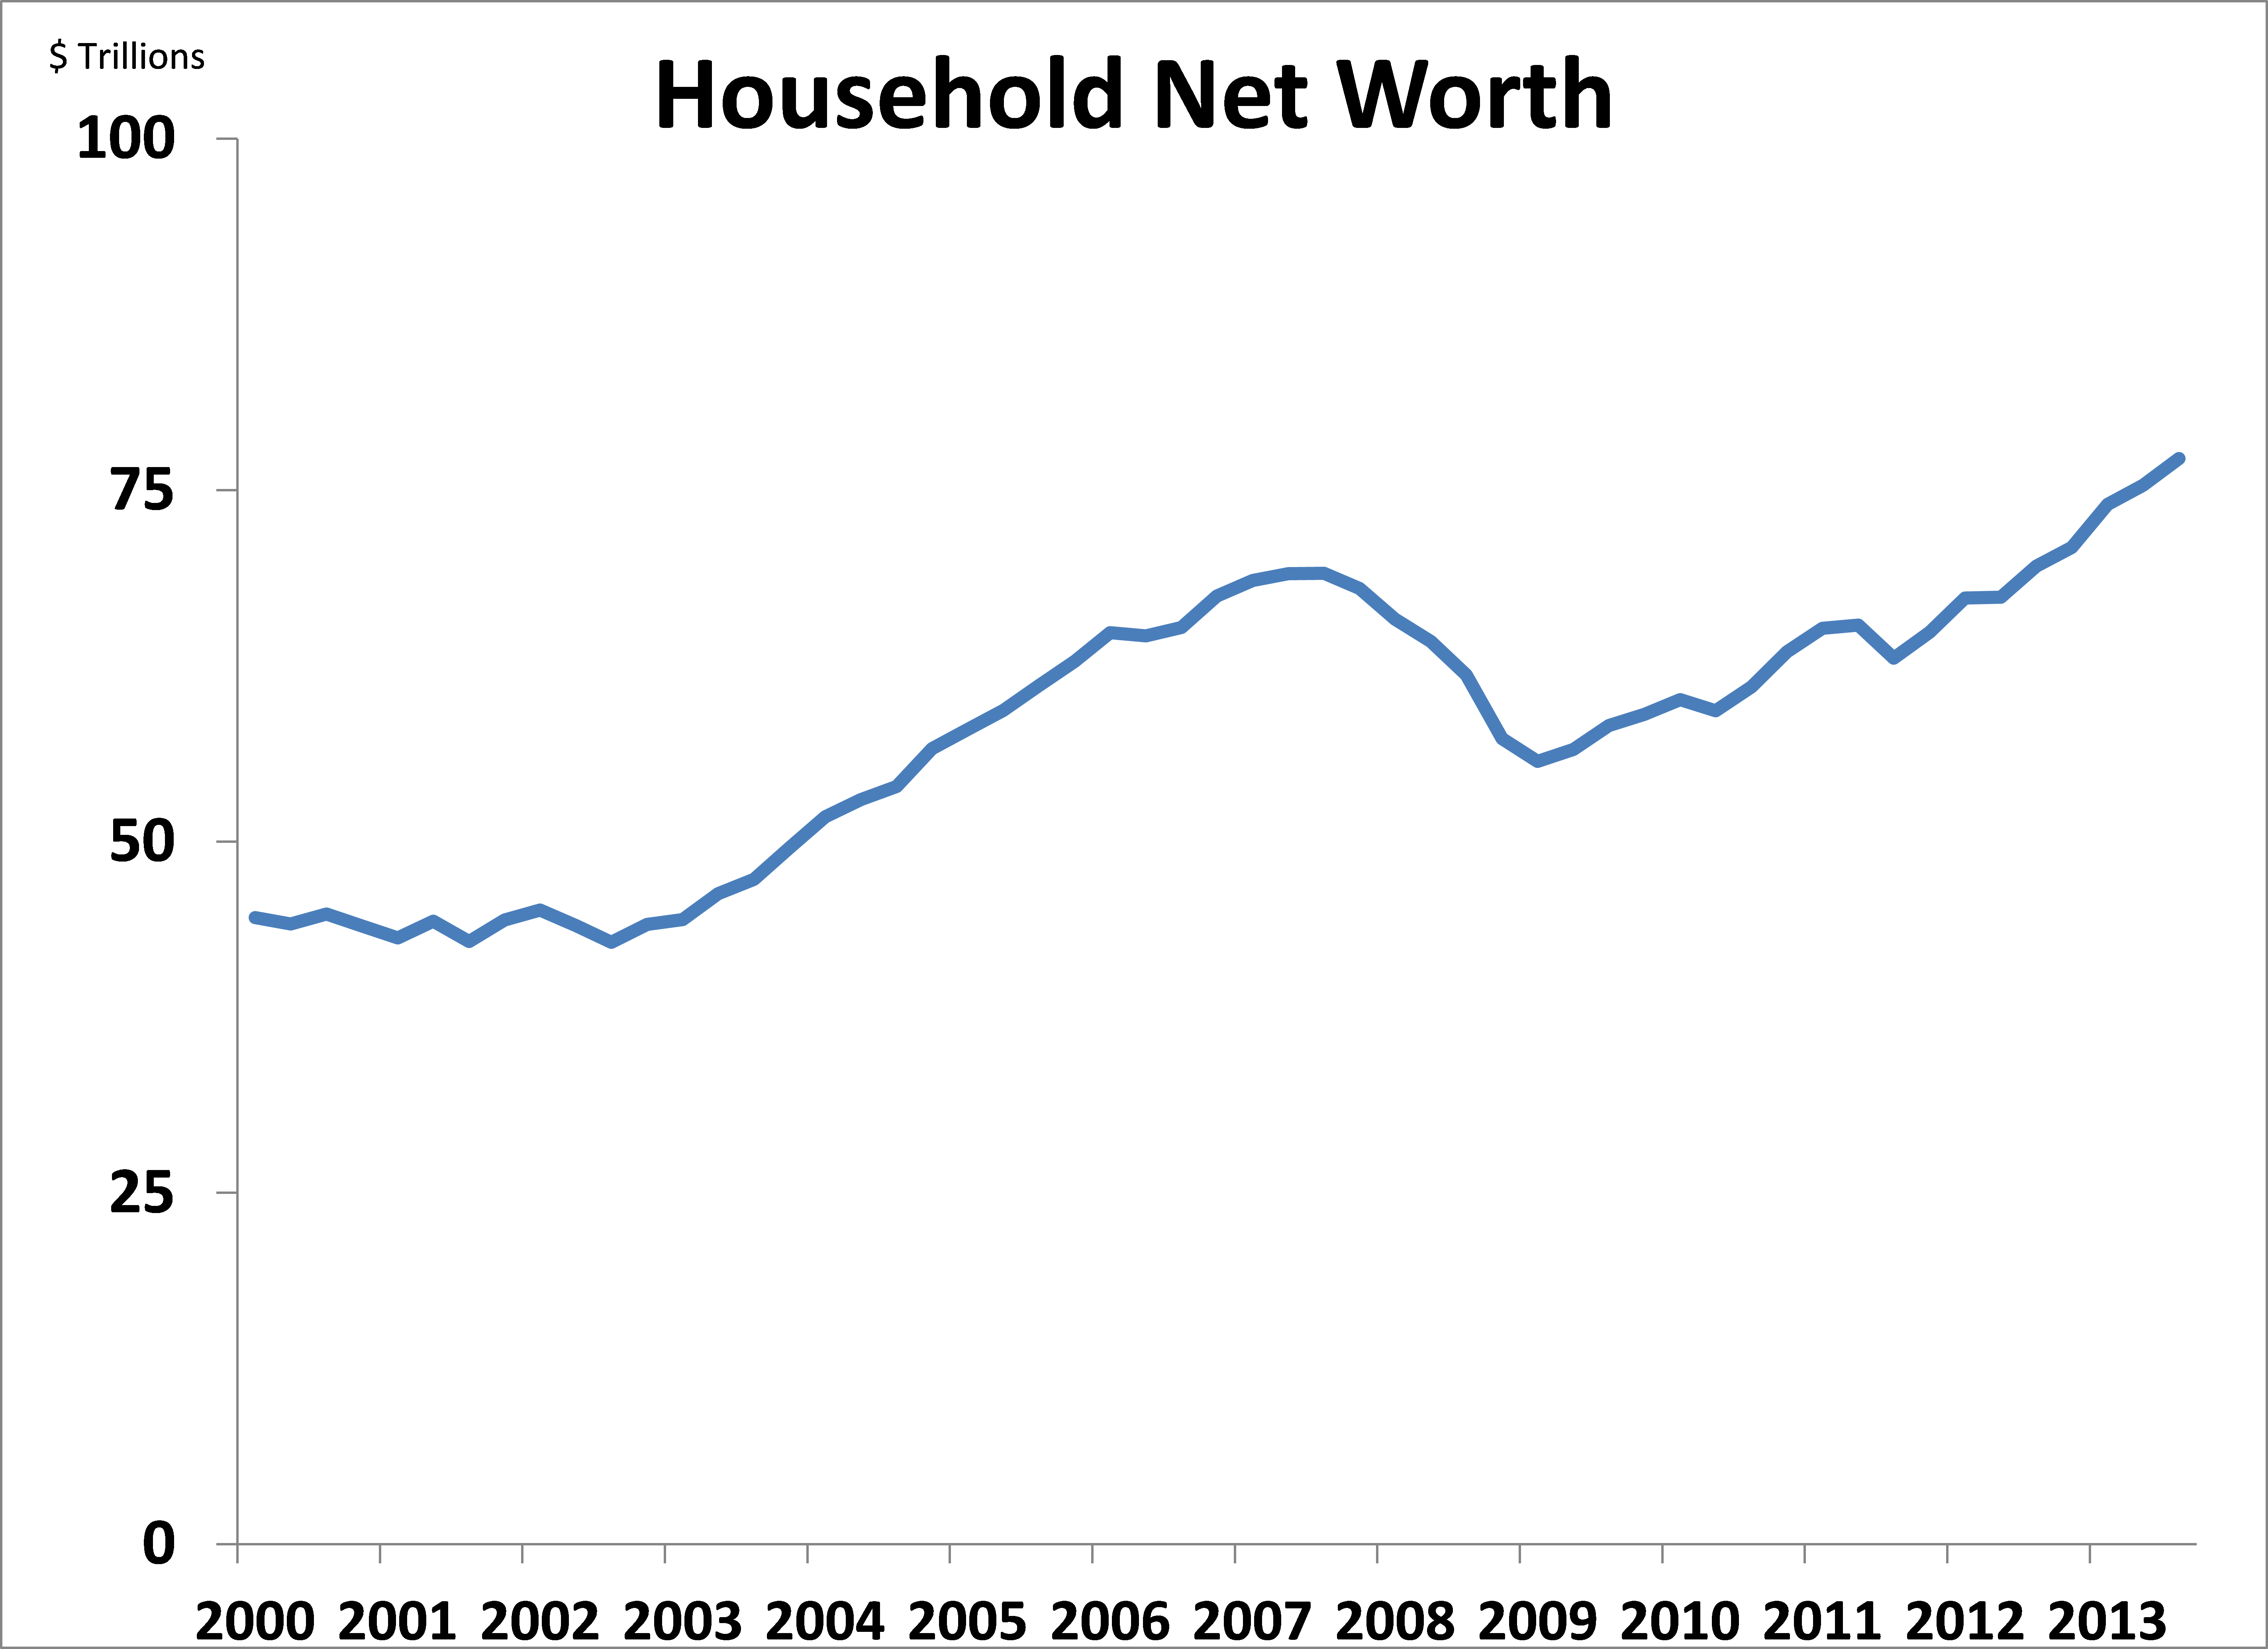
Chart 4
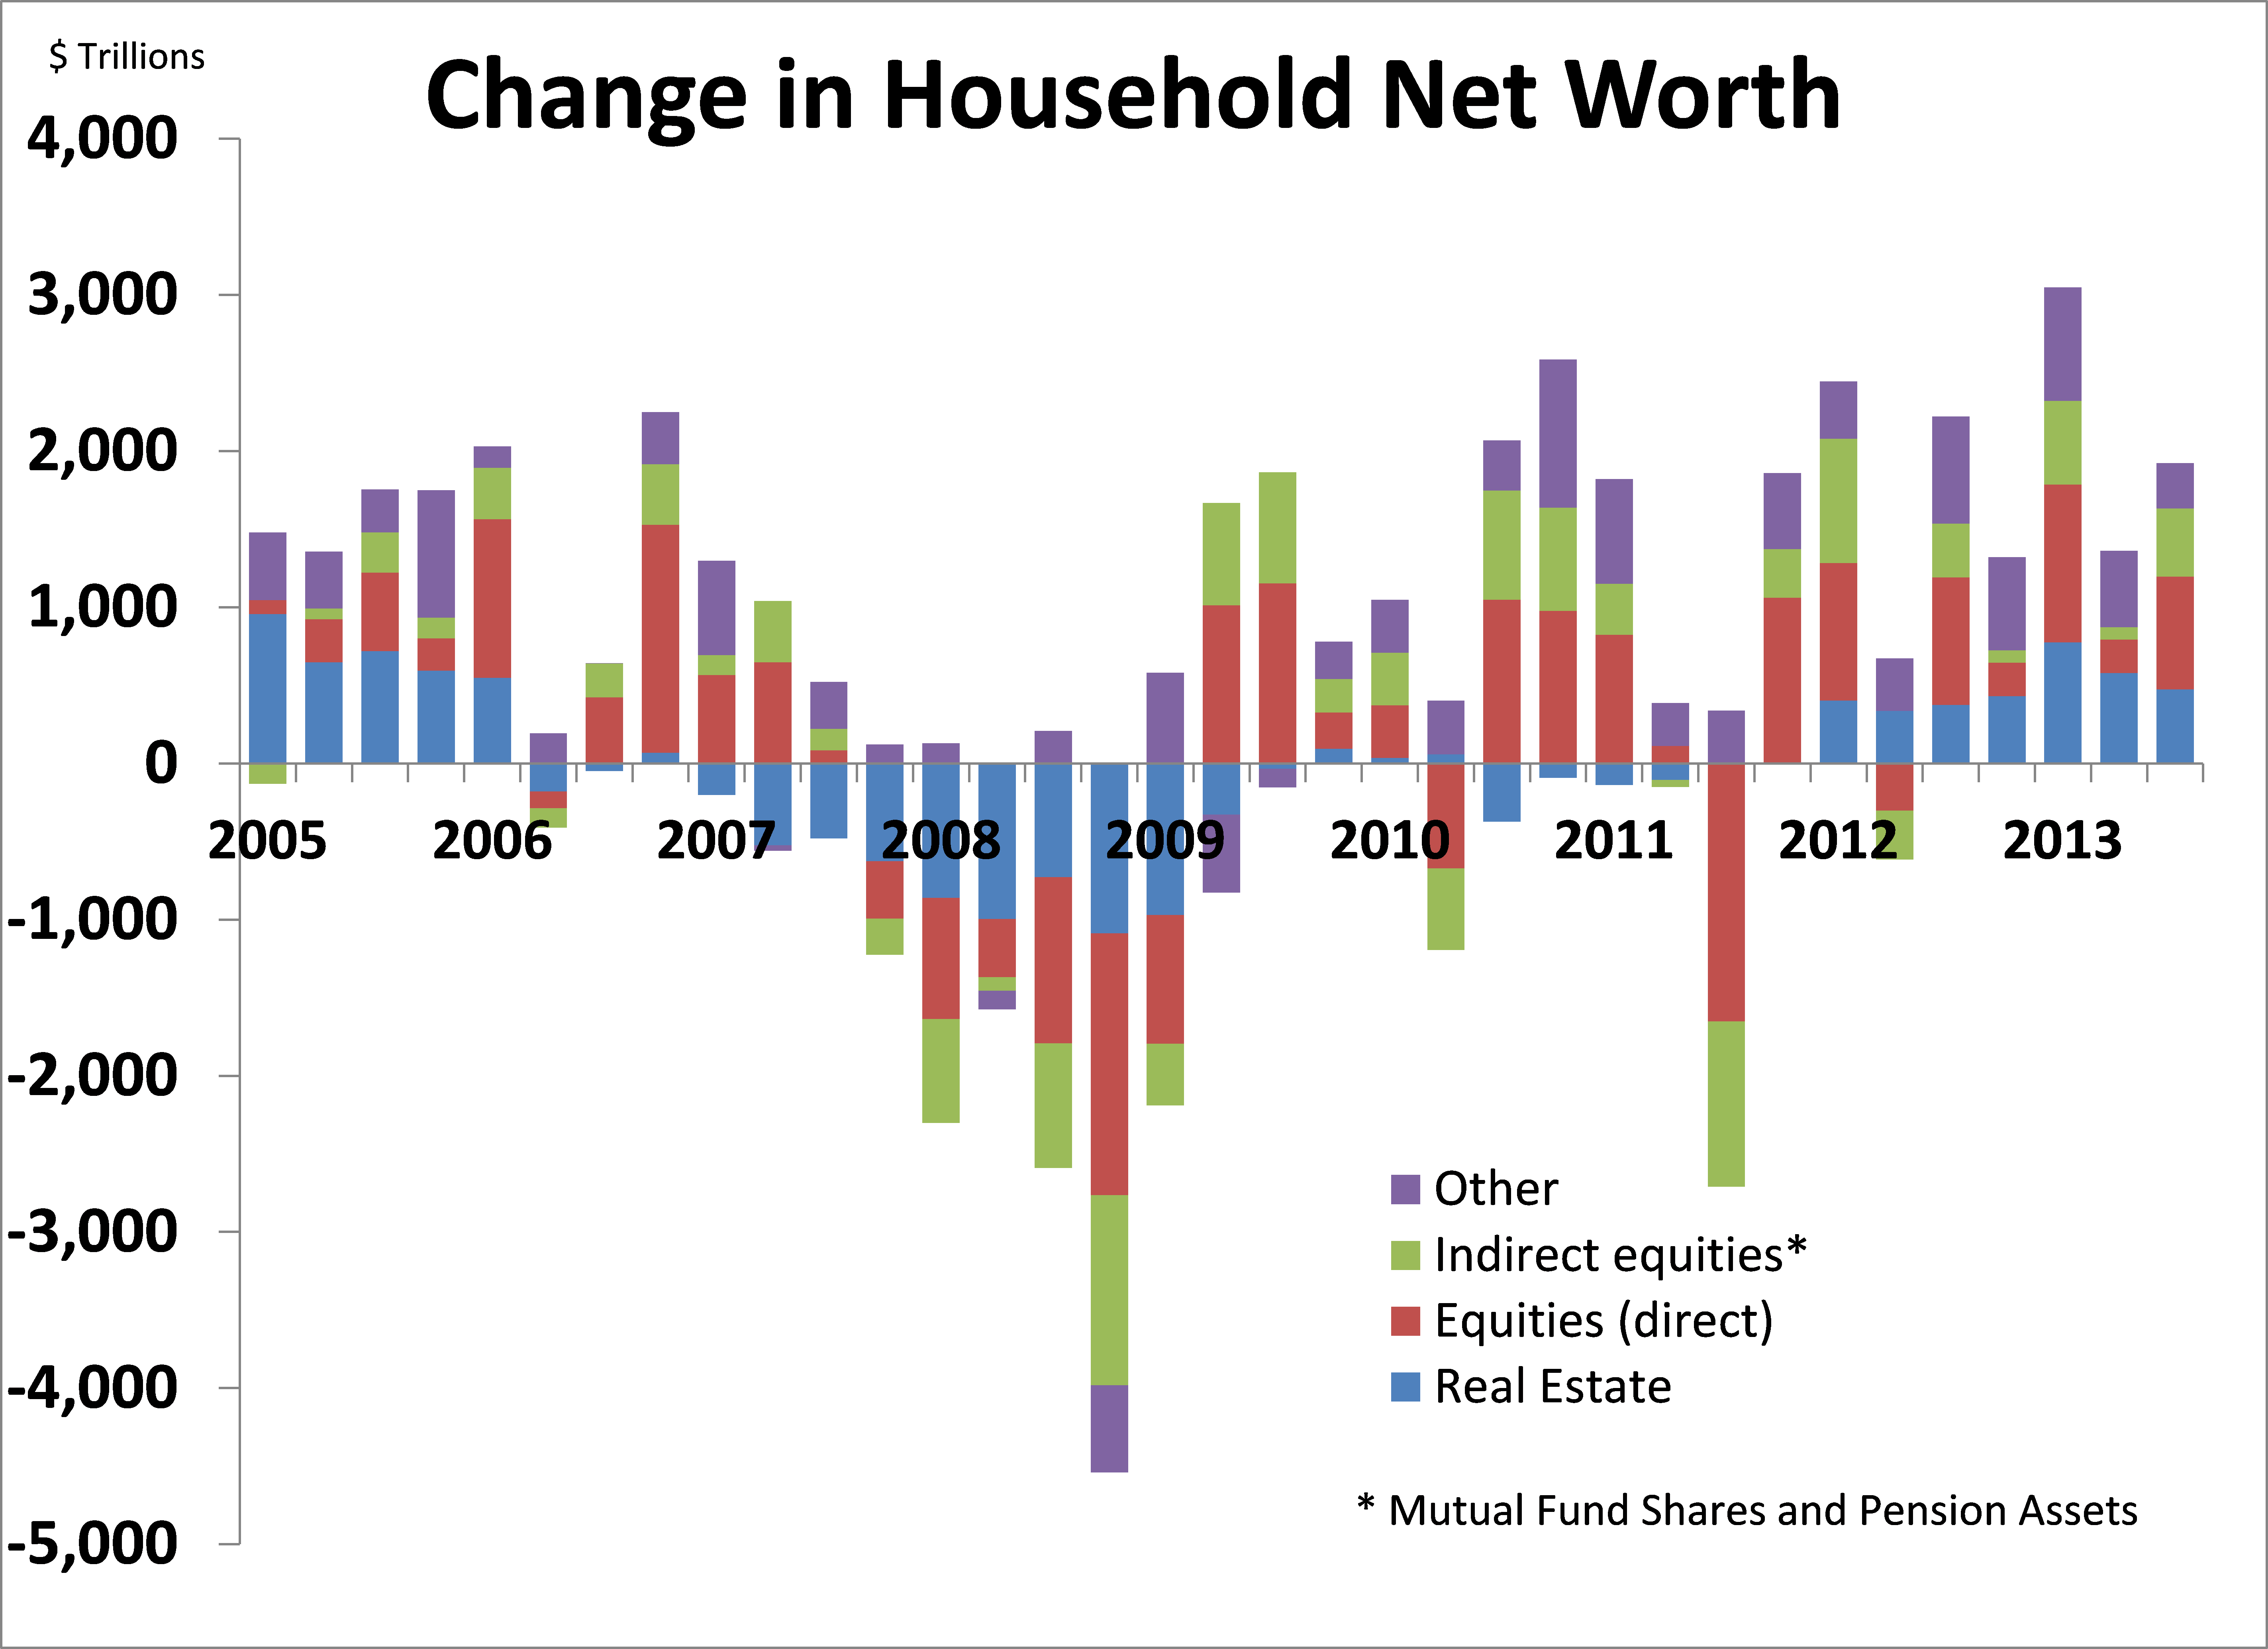
Chart 5
Commercial Property Update 2013:Q3 (November 20, 2013)
The picture was mixed across property types, with apartments enjoying strong demand as vacancy rates push yet lower, the office sector experiencing a slow recovery, and retail sector still barely out of the starting gate. The job market firmed a bit in recent months but still lacks vigor. Household formation lost steam, leading to less demand for apartments in the near term (or perhaps reflecting a lack of availability). Over the long term, however, the 4 million or so households that are currently doubled up with roommates or family – “shadow demand” – will sustain apartment demand once the job market improves. Commercial property prices rose in the third quarter, despite higher interest rates and the government shutdown. Check the latest Commercial Property Update for details.
Economic Update (August 8, 2013)
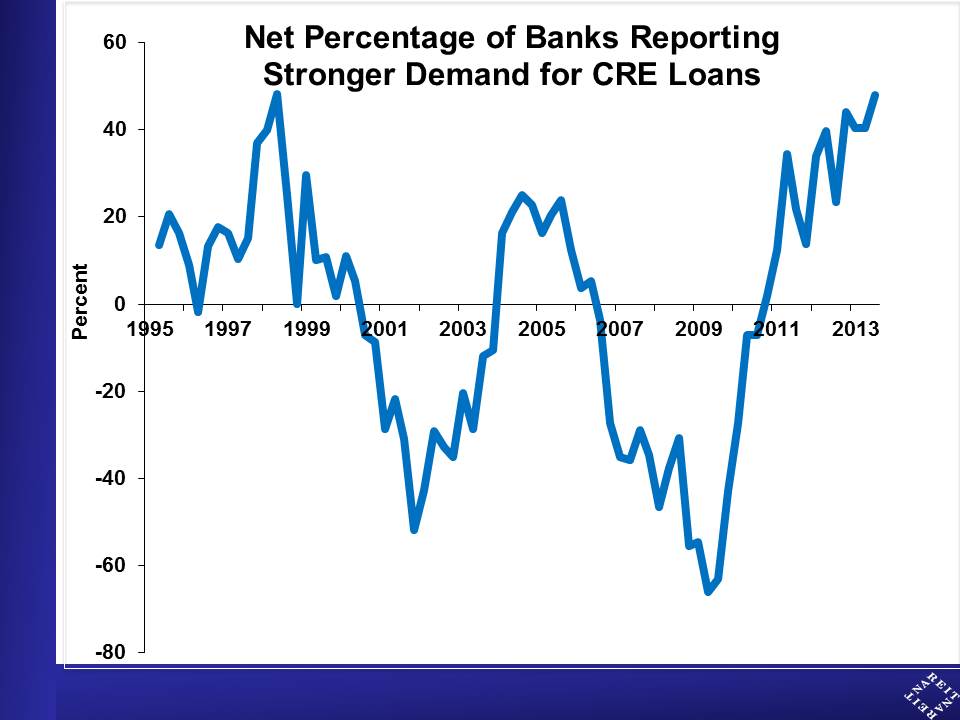
Rising borrowing demand and supply of commercial credit indicate that a broader recovery is underway.
There are new signs of life in the commercial mortgage market that indicate a strengthening of the recovery in the commercial property sector. The Federal Reserve’s Senior Loan Officer Survey shows that nearly half of all banks report stronger demand for commercial loans:
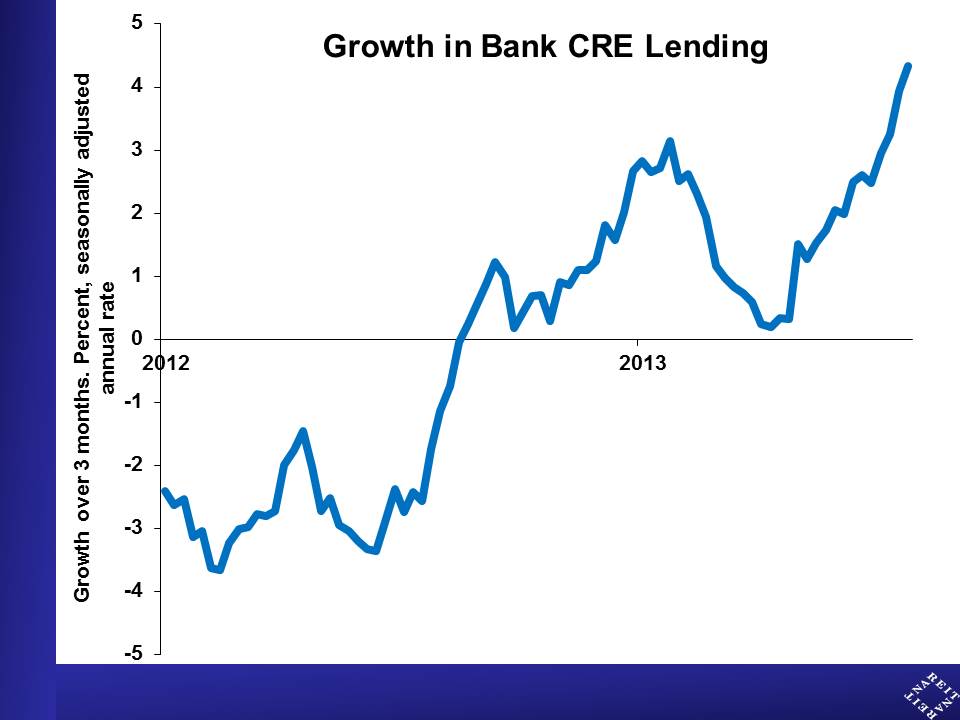
Actual lending volumes are not large yet, but there has been a significant turn-around in recent months. Commercial real estate loans on bank balance sheets continued to run off through late last year, and had little momentum as recently as three months ago. Since then, however, lending volumes have accelerated to a 4¼ percent annual rate:
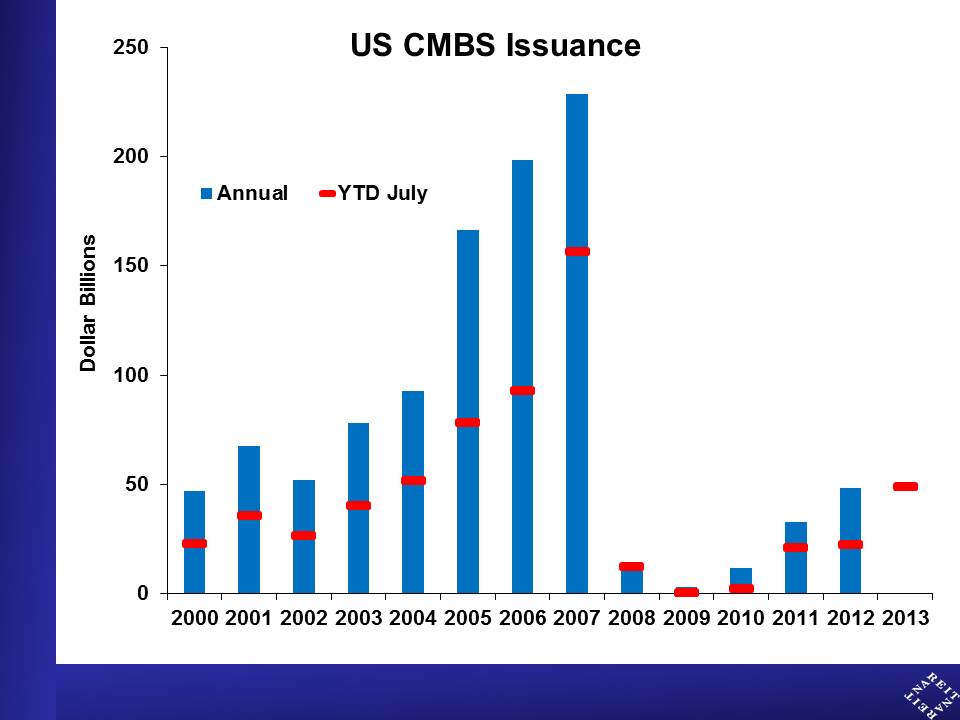
The CMBS market has started hitting on all cylinders as well, with issuance through July running about twice last year’s pace:
REITs, in contrast, slowed their borrowing recently. This can be traced to REIT equity prices, which weakened in response to the discussion of a possible tapering of bond purchases by the Federal Reserve. These cheaper share prices increased the cost of capital for REIT purchases of commercial properties, which they finance in part with debt. As a result, REIT issuance of unsecured debt in June and July were about half the pace of the prior three months:
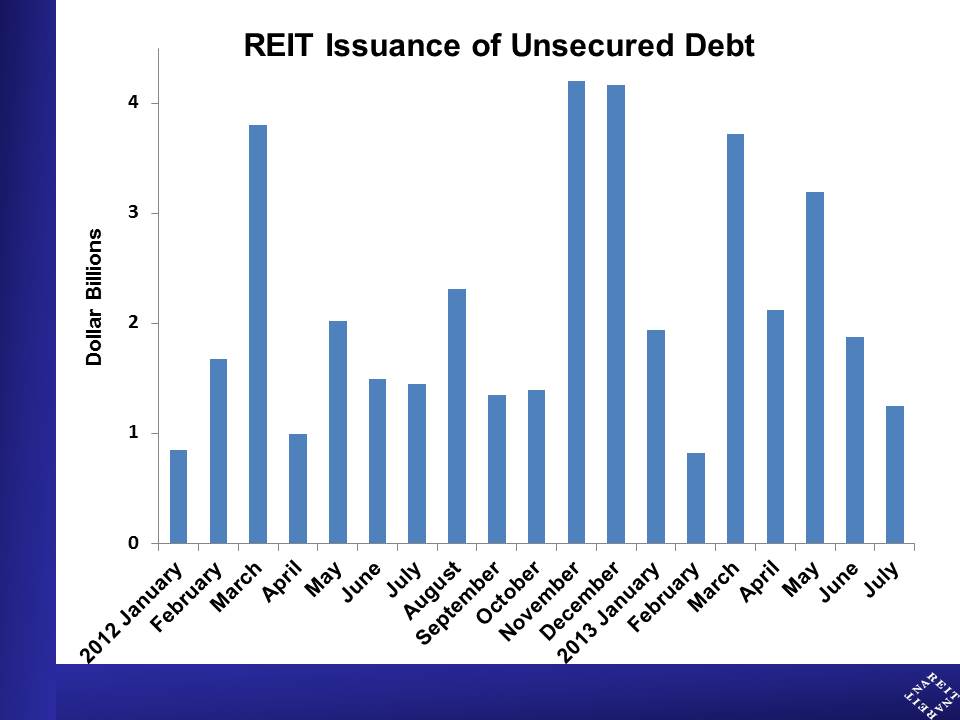
REITs are not fixed income, however, and the recent selloff in share prices in response to higher interest rates is likely to be reversed in the months ahead. Higher interest rates reflect a strengthening overall economy, which will continue to support the improvement in commercial property markets. As this happens, REITs are likely to experience higher rent growth, driving FFO and share prices higher.
For more discussion of these trends, see the recent web video here.
Commercial Property Update 2013:Q2 (August 6, 2013)
Apartment markets held firm in the second quarter despite a rebounding home sales market, while office and retail sectors saw little improvement. Job growth slipped in July but economic fundamentals overall are supporting property markets. Interest rates are still low despite the recent rise. Check the latest Commercial Property Update for details.
Economic Update (May 10, 2013)
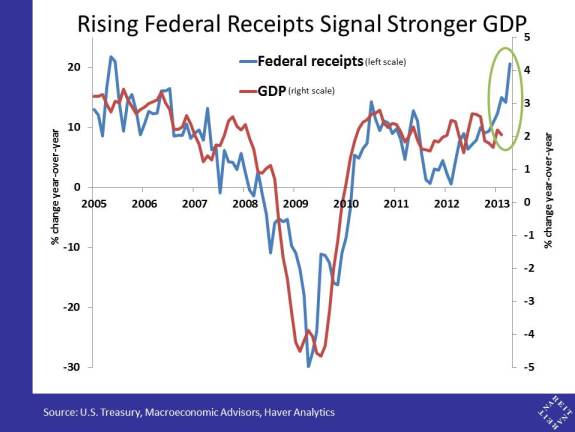
Federal revenues signal a stronger economy
Federal government revenues are closely related to the strength of economic activity, because as workers’ incomes and business sales rise and fall, their tax payments follow suit. The U.S. Treasury Department reports revenues less than two weeks following the end of a month, making the trend in revenues a useful real-time indicator of the growth of the overall economy.
The chart below shows that revenues and GDP growth track each other closely over time. Revenues have accelerated strongly in early 2013, and rising more than 20 percent over year ago. This is the most rapid acceleration in almost a decade, suggesting that the economy continues to gain momentum.
The surge in Federal revenues supports our outlook of stronger GDP growth driving an improvement in commercial real estate in the second half of this year and in 2014. While we expect cuts in government spending due to the sequester to reduce GDP growth relative to the baseline, most other news indicates that the baseline has risen this year—perhaps by an even greater amount.
Commercial Property Update 2013:Q1 (May 9, 2013)
Economic Update (April 30, 2013)
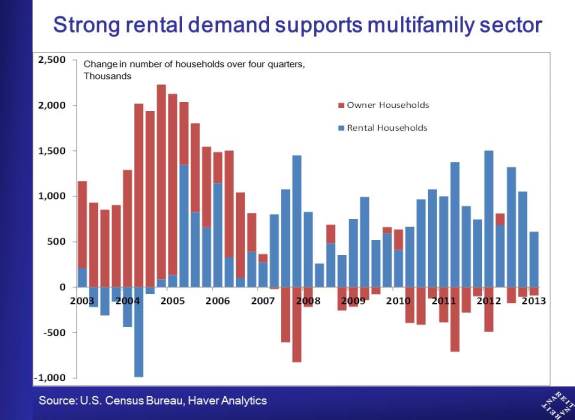
Strong Rental Demand Still Driving Fundamentals for Multifamily Housing
The demand for rental housing continued its strong growth in the first quarter, with total rental household growth accelerating to a 3.1 percent annualized rate. The number of owner-occupied housing units, in contrast, continued to decline.
Demand for rental housing shows no signs of slowing, even as the single-family home sales market shows signs of new life. In part this reflects investors who are buying homes to convert to rental use. In addition, however, the large pent-up demand of potential renters who are currently doubled-up with family and friends provides strong support for multifamily housing, and will likely continue to do so well into the future.
The state of household finances makes renting a more attractive option than home purchase, and it will take years for many of those currently sharing living space to save for a down payment and qualify for a mortgage to buy a home. In short, worries about the end of the renter era are premature.
The recent data on household formation also dispel concerns about a coming wave of supply across the nation. The number of occupied rental households rose 610,000 over the past four quarters. Even taking into consideration those single-family rentals mentioned above, the growing demand far exceeds new construction; multifamily housing starts rose in the first quarter to a 325,000 annual rate. Some markets face a burgeoning supply pipeline, but the overall balance between new construction and household formation across the country indicates a further firming of rental occupancy rates this year and next.
Economic Update (April 26, 2013)
Another disappointing GDP report
GDP growth in the first quarter fell short of expectations, with a 2.5 percent annualized increase (consensus had expected 3 percent growth or more). This is roughly in line with the economy’s potential growth rate, and not strong enough to “catch up” the ground that was lost during the recession, either in terms of reducing unemployment, or vacancies in offices, retail stores and other commercial buildings.
Economic growth was weighed down by continued cutbacks in federal defense spending, state and local government budgets, and paltry economic growth in Europe and other global trading partners. Private domestic demand—that is, spending and investment by U.S. households and businesses—posted a robust 3.8 percent rate of growth.
There are two important engines of growth that we expect to contribute to the economy’s momentum in the months ahead:
- The housing recovery is adding directly to GDP growth, with a 12.6 percent rise in residential investment. The indirect effects on the economy are likely even more important, including household purchases of appliances and furniture, rising home values helping heal household balance sheets, and bolstering consumer confidence.
- The job market provided good news in the GDP report. Yes, you read that correctly; rising wages and salaries are making a more positive contribution to household incomes. In particular, wages and salaries have risen at an annualized 3.7 percent growth rate over the past half-year, nearly twice the 1.9 percent increase over the prior six months. This stronger income growth provided critical support to the 3.2 percent growth in consumer spending, the best since 2010.
The Bottom line: GDP growth fell short of expectations due to further cuts in government spending and struggling growth in Europe and other trading partners. U.S. households and businesses, however, continue to gain ground. We expect the gathering momentum in private domestic demand will contribute to more consistent headline GDP growth later this year and next.
Economic Update (April 10, 2013)
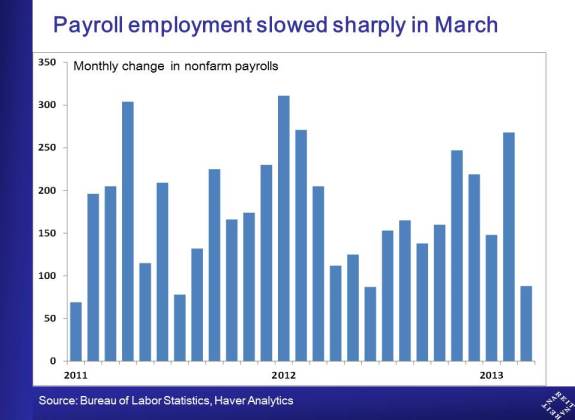
Does the dismal employment report for March warn that the economy has stumbled again?
Nonfarm payrolls rose just 88,000 in March, a far cry from the 190,000 that analysts had expected, and the weakest monthly hiring since July 2012 [first chart below] . Is this a harbinger of a sharp slowdown in economic activity due to the sequester and the recent hike in payroll taxes? Let’s examine the details of the report, as well as other data, to look for signs of such a slowing.
Detail of the March job report
- Revisions. The March employment report showed an upward revision of 61,000 to employment growth in January and February, which offsets some of the weakness of the headline figure. Even so, the average monthly payroll growth slowed to 168,000 in the first quarter, from 209,000 in the fourth quarter of 2012. More worrisome is that the upward revision to January and February makes the slowdown in March look even more like the economy fell off a cliff.
-
Industry details. Which industries accounted for the 180,000 deceleration in payroll employment between February and March? And what does other news have to say about those industries? Three industries accounted for more than half of the slowing in the growth of payroll employment:
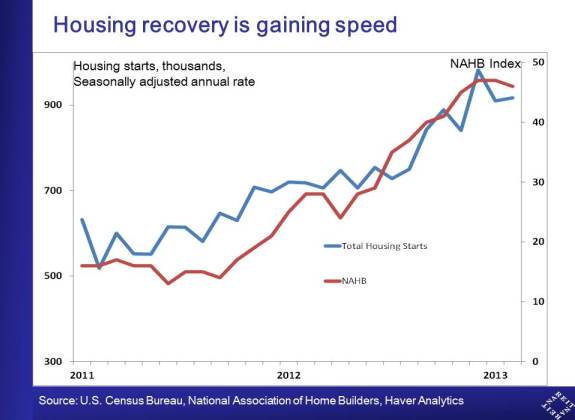
- Construction net employment growth slowed by 29,000 in March. But all other indicators (housing starts, sales of new and existing homes, pending home sales, the index of the National Association of Home Builders (NAHB)) all show that the housing sector is gaining momentum, not slowing [second chart below].
- Manufacturing employment fell slightly after several months of strong gains. But the ISM manufacturing survey is still in positive territory, and strong auto sales are more consistent with rising output than a cutback in manufacturing.
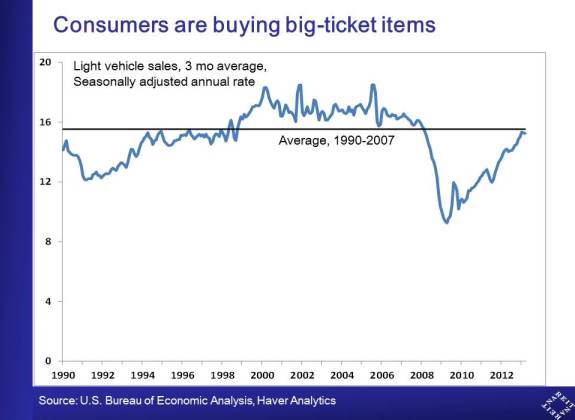
- Retail trade employment fell 24,100. But consumer spending has surprised on the upside lately. For example, auto purchases, a good indicator of consumer discretionary spending, have continued to move up steadily [third chart below].
- Government payrolls fell 7,000, with the U.S. Postal Service cutting 11,700. Furloughs and other cutbacks resulting from the sequester will impact government employment in the months ahead, but this doesn’t explain any of the weakness in March.
-
Other labor market news:
- Average workweek and index of weekly hours both continued to rise in March, which typically indicates stronger demand for labor;
- Average hourly earnings edged up.
- Initial claims for unemployment insurance have declined steadily, which is at odds with the March payroll report. (Claims jumped in the most recent week, but difficulties adjusting for seasonal patterns around the Easter holiday make this number suspect.)
Bottom line: the sharp slowing in payroll growth does have us concerned about the durability of the economic recovery, especially in light of the sequester and recent increases in payroll taxes.
All of the industry details and other labor market and macroeconomic news, however, suggest the economy continues to move forward, albeit in an uneven manner and at a disappointingly slow pace.
For more information on how the recent job market news affects the outlook for the overall economy and for commercial real estate, see the following REIT.com video.
Economic Update (February 28, 2013)
Budget issues are likely to slow economic growth relative to baseline... but what's happening to the baseline?
Two issues have dominated recent economic headlines: the impact on consumers of the increase in payroll taxes that took effect at the beginning of the year, and the likely effects of an $85 billion cut to federal spending due to sequestration, should the Administration and Congress fail to reach a last-minute budget deal.
The cumulative effect of these fiscal changes is likely to be important, reducing GDP growth by one to two percentage points relative to the baseline outlook. There has been little discussion, however, of how that baseline may be moving.
The recent economic news outside of federal budget issues has been marked by upside surprises, suggesting that the baseline in fact has been moving up:
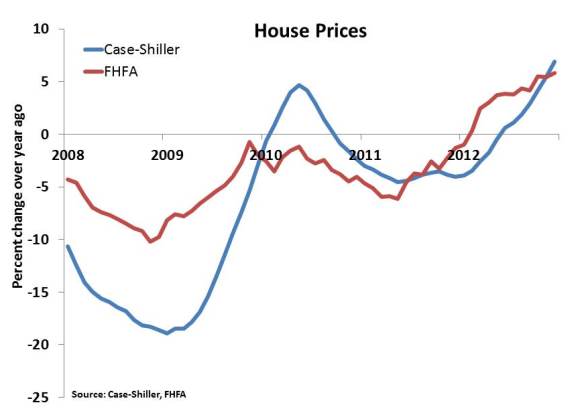
- Housing market. Home sales have firmed, and pending home sales jumped in January, pointing to a further acceleration in sales in 2013; inventories of homes for sale are low, and many metro areas can be described as a “seller’s market” for the first time in years; home prices are recovering (Chart 1)
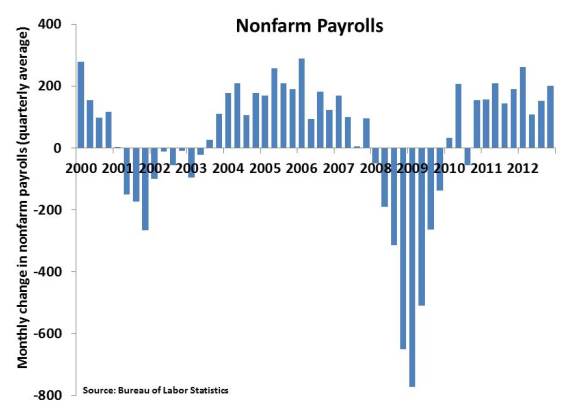
- Labor markets. Job growth accelerated late last year to a 200,000+ pace. While this is not yet strong enough to reduce the unemployment rate significantly, hiring regained momentum in the second half of 2012 (Chart 2). Initial jobless claims are trending down, and recently moved to the lowest level since before the financial crisis.
- GDP trends. Overall GDP growth stalled in 2012:Q4, to a 0.1 percent annualized pace, according to the most recent estimate. A drop in national defense spending subtracted 1.3 percentage points from GDP growth, however, and inventory investment took off another 1.5 ppts. Outside of these pieces, which are best viewed as transitory and not indicative of future prospects, private final sales growth firmed to nearly 3 percent in late 2012.
- Business investment. Real business spending on equipment and software rose at a double-digit pace in Q4, and construction of commercial buildings firmed as well. More recent data on orders for durable goods excluding the volatile transportation equipment sector rose nearly 2 percent in January. These reports indicate that the business sector is gaining momentum.
- Consumer confidence. There are several surveys of consumer confidence, all of which have been buffeted by concerns about the fiscal cliff and sequestration. Even so, confidence has been resilient, suggesting that improvements in job markets and the housing markets are offsetting some of the negative impact of the federal budget issues.
The take-away from these recent reports covering most of the economy — housing markets, labor markets, business investment, consumer confidence — is that the underlying momentum for economic growth has been moving up in recent months. The current federal spending issues are likely to restrain growth a bit, but there is an unmistakable sense that the economic baseline is gaining traction.
Commercial Property Update 2012:Q4 (February 7, 2013)
Commercial property markets improved in late 2012 despite uncertainty about the fiscal cliff. Apartment vacancies declined further while office rents posted the strongest gain in years. The retail sector is moving sideways. Economic growth was mixed. Inventories and defense spending were weak, but core GDP—private domestic final sales—posted moderate gains. Job growth was revised higher, to 200,000 per month for the fourth quarter, a significant move towards healthier labor markets. Check the Commercial Property Update for more details.
Economic Update (December 13, 2012)
The employment report for November was in line with consensus expectations, with an increase in payroll employment of 146,000, but a moderate downward revision to the October figures. The unemployment edged down a tick, to 7.7 percent.
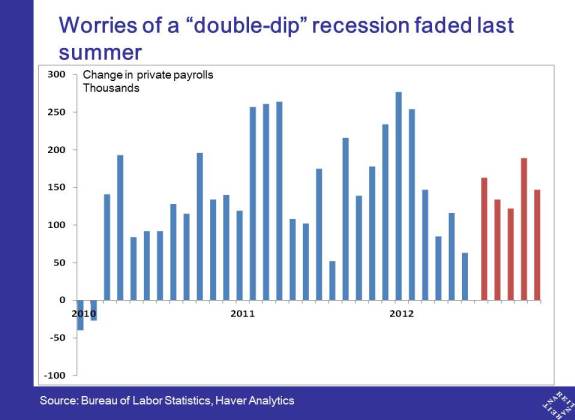
While this pace of job growth is unexciting, it is considerably better than late summer, when there were widespread worries that weak job growth posed risks of a double-dip recession. Increases in private payrolls over the past five months — the red bars in chart 1 — averaged about 150,000 per month, more than twice the speed we saw last spring. Job growth year-to-date is slightly ahead of 2011.
The economy has generated about 5 million new jobs since the end of the recession, and has recovered about half the total job losses during 2008 and 2009. There are other signs of improvement, however, including a 1.2 million decline in the number of people who are working part-time for economic reasons. That is, over a million people who previously wanted full-time work but could only find part-time jobs are now working a full workweek. The number of people working part-time is still very high, but it is headed in the right direction.
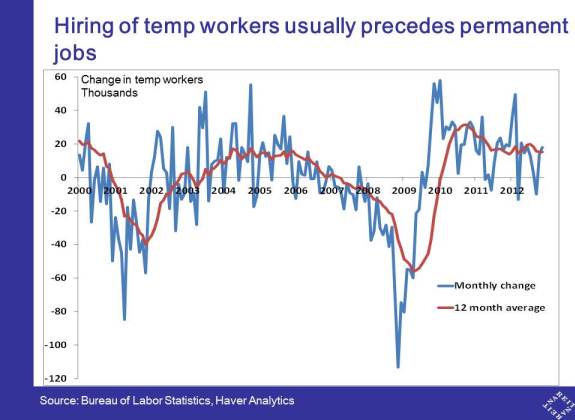
Temp workers are giving another positive sign for future job growth. While many workers in temporary positions would prefer a permanent job, employers often turn to temps while they are searching for a full-time employee, or if they are waiting to see if an upturn in sales appears sustainable. The number of temp workers has been growing a fairly steady 20,000 or more per month since 2010, a relatively high level compared to trends over the past decade, which signals continued increases in permanent jobs ahead (chart 2).
The outlook for commercial real estate markets depends on two main macroeconomic factors. First, the overall rate of GDP growth, and the increases in office employment, consumer spending and household incomes that accompany stronger GDP growth. The latest jobs numbers suggest that the improvements may be slow and gradual, but are progress nonetheless and likely to gain momentum in 2013.
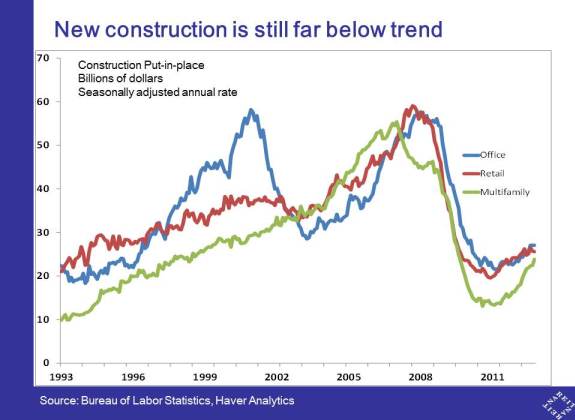
Second, the supply of new commercial construction remains a little above 20-year lows (chart 3). Developers cancelled or postponed many projects during the recession. Activity has been slow to pick up due to concerns about the durability of the economic recovery and tight financing conditions. With so little new supply in the pipeline, the stronger GDP growth we anticipate should translate into rising occupancy, rents and prices of commercial properties.
For more details on recent economic numbers and the outlook for commercial real estate, see the REIT.com video.
Commercial Property Update 2012:Q3 (November 6, 2012)
The commercial property market recovery took a breather in Q3, with smaller improvements in vacancies and slower rent growth in all main property types. Economic fundamentals began to regain momentum more recently, suggesting better times ahead. Check the Commercial Property Update for more details.
Commercial Property Update 2012:Q2 (August 3, 2012)
Performance was mixed in commercial real estate markets in the second quarter, with the apartment sector posting a strong quarter but office and retail moving sideways. These results largely reflect the economic fundamentals, with GDP and employment growth losing momentum through the spring. While avoiding recession, the economic recovery to date lacks vigor.
Learn more in our full report on second-quarter conditions in commercial real estate markets.
Economic Update (August 16, 2012)
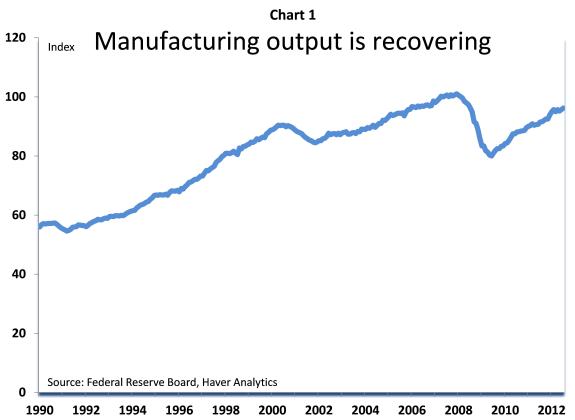
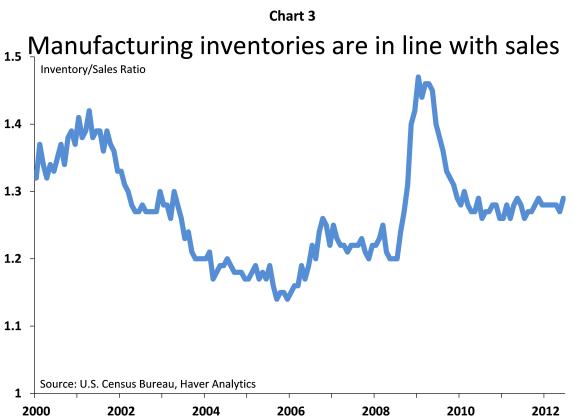
The manufacturing and industrial sector has had a choppy recovery around a rising trend:
- Manufacturing production rose 0.5 percent in July and is 5.0 percent above a year ago;
- Output is still 5 percent below its pre-recession peak (Chart 1);
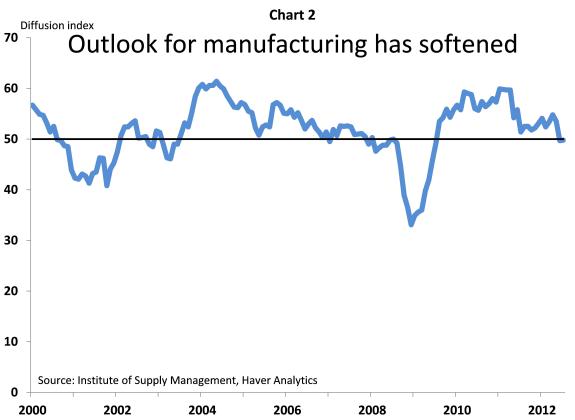
- The outlook has softened with the weakening global economy: debt crisis in Europe and the U.S. “fiscal cliff” (Chart 2);
- But the economic fundamentals for manufacturing remain firm; for example, there is no inventory overhang, as they are in line with sales (Chart 3);
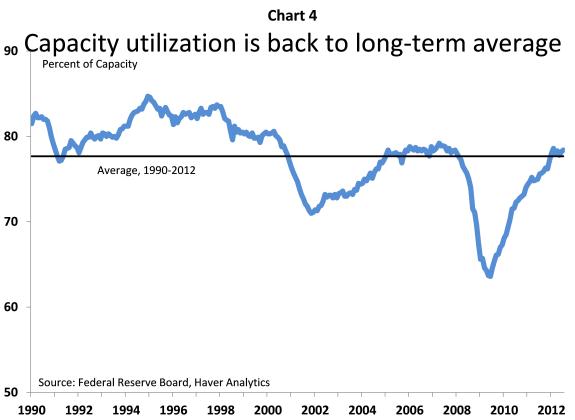
- Capacity utilization is back to long-term trends (Chart 4). Future increases in production will require more CAPX, which will support overall GDP growth;
Industrial properties saw further improvement in Q2:
- Occupancy rates rose, but rent growth decelerated;
- The supply pipeline of new development is growing. New supply should not be a problem if the U.S. economic recovery regains momentum later this year and early next year, as we expect, but poses some risks to the sector should the macroeconomic slowdown be more severe or longer-lasting.
Economic Update (August 1, 2012)
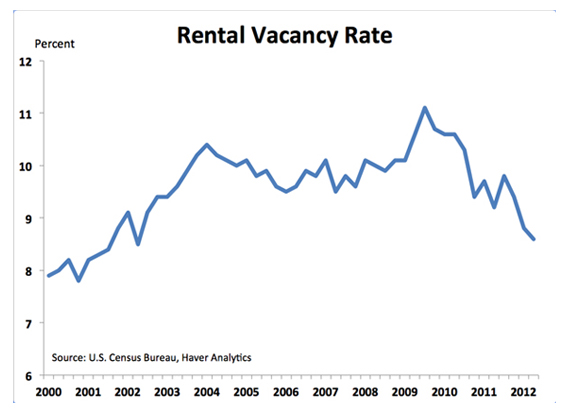
The fundamentals for multifamily residential sector continue to improve in the second quarter, as rental vacancy rates fell to the lowest level in a decade.
- The rental vacancy rate declined 20 bps, to 8.6 percent, compared to a peak above 11 percent in 2009 (Chart 1).
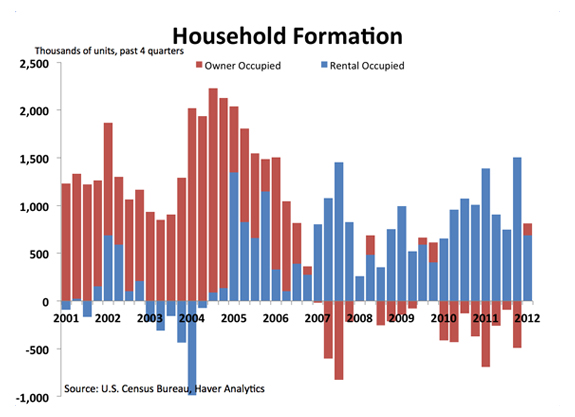
- New demand for living space is flowing almost entirely into rental units (Chart 2).
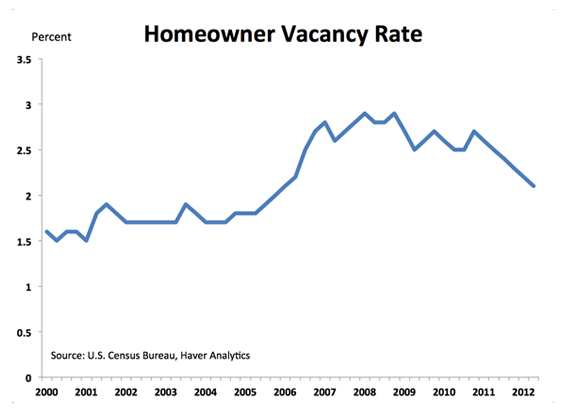
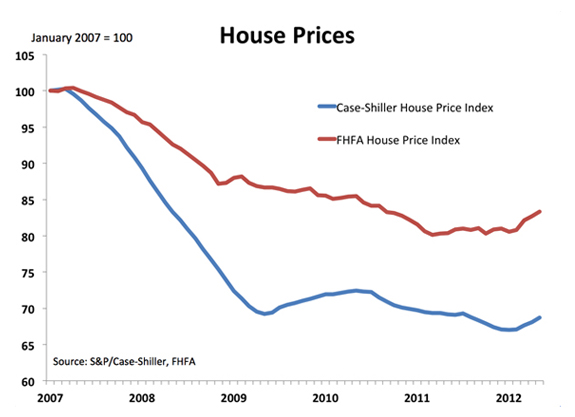
- Demand for rental units remains strong even as the homeowner market begins to stabilize. For example, the homeowner vacancy rate has fallen nearly a full percentage point from its peak (Chart 3) and housing prices have turned up in recent months (Chart 4).
Economic Update (July 6, 2012)
Disappointing job news contrasts with improving multifamily housing trends.
- There was no silver lining in the June employment report, which showed net gains of 80,000 and the unemployment rate unchanged at 8.2 percent. Job growth in the second quarter averaged 75,000 per month, half the pace in 2011 and well below the 225,000 in Q1.
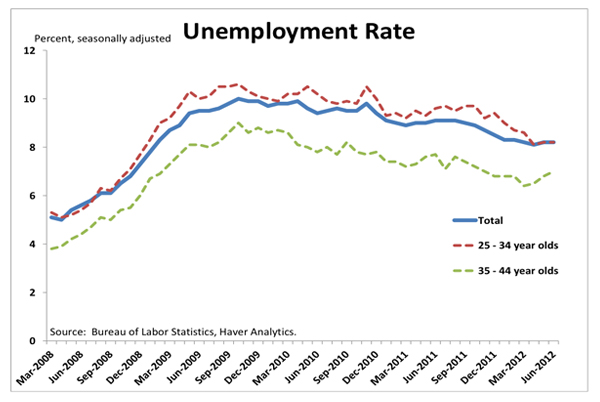
- Young workers are still struggling. Unemployment rates among 35 – 44 year olds rose to 7.0 percent in June, from 6.8 percent in May and a recent low of 6.4 percent in March, while the unemployment rate of 25 – 34 year olds was unchanged at 8.2 percent. These young adults generate most of the new demand for rental apartments, and the outlook for multifamily housing is strongly influenced by their job prospects.
- Yet the apartment sector continues to improve. Apartment vacancy rates fell another 20 bps in the second quarter, according to Reis, Inc., while rent growth accelerated. The contrast between the gloomy job market for young adults and rising occupancy reflects a huge pent-up demand for apartments. NAREIT estimates a “shadow demand” of 3 million or more households that “doubled up” during the financial crisis. While the recent slowdown in hiring and overall economic activity will no doubt impact the apartment sector’s outlook, current trends despite the strong headwinds from the job market and macroeconomy confirm the strength of the fundamental forces driving the rental market.
Economic Update (May 30, 2012)
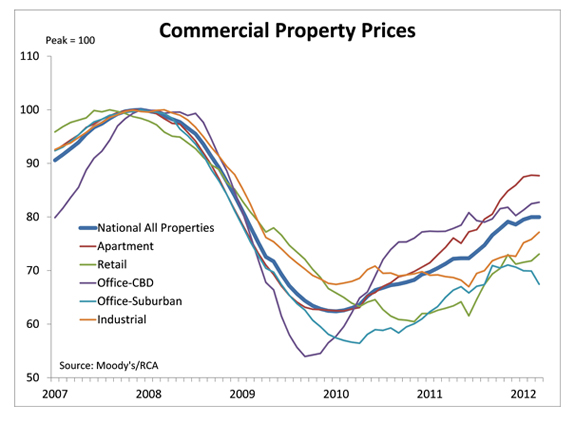
Commercial property prices were flat in March. The recovery in commercial property prices paused after having regained nearly half the decline that occurred during the financial crisis.
- Apartment prices edged down 0.1 percent in March. Prices rose 18.0 percent over the prior 12 months, outpacing other commercial property sectors, and have recovered two-thirds of the peak-to-trough decline;
- CBD office prices moved higher with a 0.3 percent increase, while prices of suburban office fell 3.5 percent. CBD office markets have recovered 62.5 percent of the peak-to-trough decline, versus 25.2 percent for suburban markets;
- Retail turned up 1.7 percent in March after having declined in December and posting weak gains in January and February;
- Industrial accelerated with a 1.7 percent increase in March, bringing the 12-month change into the double-digits for the first time since 2007.
Economic Update (May 18, 2012)
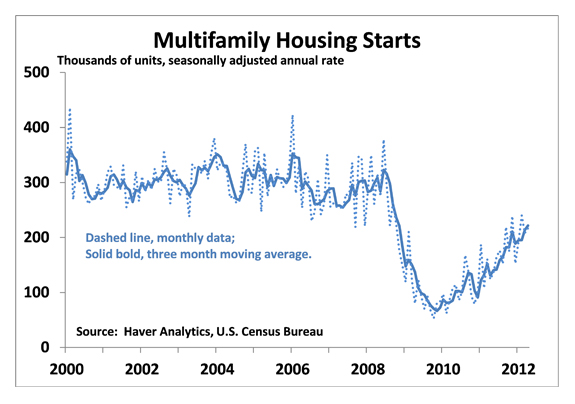
Construction of new multifamily housing units continues to recover as apartment rental market conditions tighten. Multifamily housing starts rose 4.3 percent in April to a 217,000 annual rate.
Despite having tripled from the lows reached during the financial crisis, multifamily starts remain well below the pre-recession trend rate of 300,000. Moreover, rental occupancy has been rising more rapidly than construction, pushing vacancy rates lower. (The Census Bureau recently reported that rental vacancy rates fell 0.6 ppt. in the first quarter to 8.8 percent, the lowest since early 2002.)
Learn more about the current outlook for multifamily REITs.
Return to Current Market Commentary