You probably already know that the total returns of exchange-traded U.S. Equity REITs have generally outpaced those of other U.S. stocks over long investment periods: For example, in the longest period measured by the Russell 3000 Index of the broad U.S. stock market—from Dec. 31, 1978, through March 31, 2016—total returns for exchange-traded U.S. Equity REITs have averaged 12.87 percent per year compared to just 11.64 percent per year for stocks. (I measure REITs using the FTSE NAREIT All Equity REITs Index.)
See REIT Average & Historical Returns Vs. U.S. Stocks for a more recent blog post on this topic.
Investors need to know whether that long-term outperformance by REITs is the “normal” state of affairs, or whether it could be only the result of a last-minute run-up in REIT stock values. Actually there hasn’t been any recent run-up in REITs (except during March 2016: +10.17% for REITs, +7.04% for stocks). In fact, during the past three years (March 31, 2013, to March 31, 2016) the Russell 3000 has actually outpaced the Equity REIT market, with total returns averaging 11.15%, compared with 9.85% for REITs.
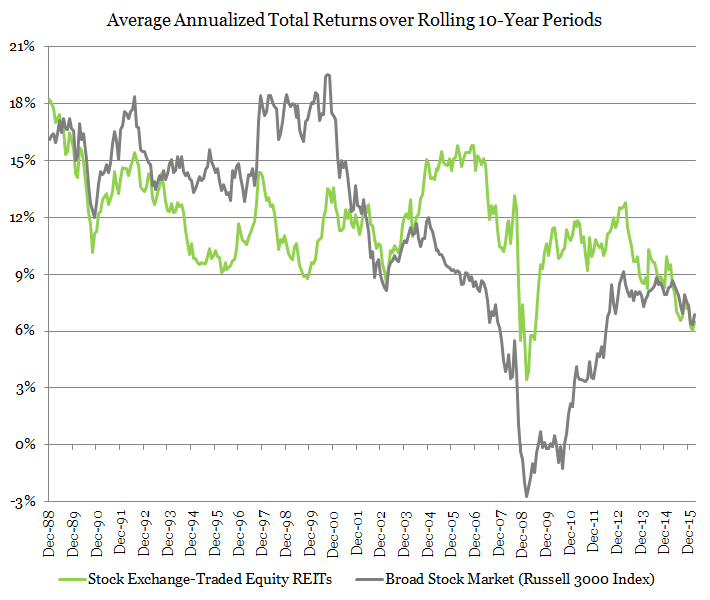
We can get a better sense of the normal situation by comparing returns over various long investment horizons. The chart below shows average annual total returns over rolling 10-year return periods, with the first such period going from Dec. 31, 1978, through Dec. 31, 1988, and the last one from March 31, 2006, through March 31, 2016. It turns out that REIT returns outpaced stock returns over exactly half of the available 10-year periods, and stocks outpaced REITs over the other half. But exchange-traded Equity REIT returns were much more dependable than stock returns: REIT returns over 10-year periods usually averaged between +10.0% and +13.3% per year and never fell short of +3.43% per year—even during the 10-year periods that included the liquidity crisis of 2008 to 2009—while stock returns were much more uncertain, usually averaging between +7.9% and +15.0% per year and actually going negative (by as much as -2.72% per year) during 17 periods that included the liquidity crisis.
For the statistical-minded, here’s another way to think about it: The cross-sectional standard deviation of the industry-wide 10-year average returns was just 7.9% for exchange-traded Equity REITs, compared with 16.9% for the Russell 3000.
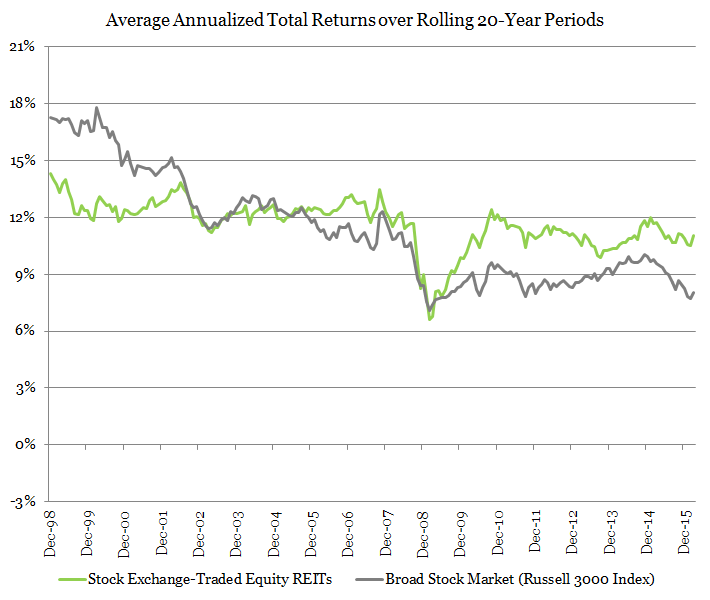
The next chart shows a similar analysis, this time of average total returns over 20-year historical periods. You can see that, again, average returns for long historical periods have been more dependable for exchange-traded U.S. Equity REITs than for the broad U.S. stock market: REIT returns usually averaged between 11.1% and 12.4% per year with a cross-sectional standard deviation of 5.7%, while stock returns usually averaged between 8.8% and 12.8% per year with a cross-sectional standard deviation of 12.6%.
At least as important, REIT returns have exceeded returns in the broad stock market during nearly two-thirds of the available 20-year historical periods, including every single period that started more recently than March 1989—that is, during the “modern REIT era.” In fact, the REIT advantage has been widening. Stocks provided long-term average total returns more than 4% greater than REITs during the earliest 20-year periods shown, while REITs outpaced stocks by close to 3% during the most recent 20-year periods.
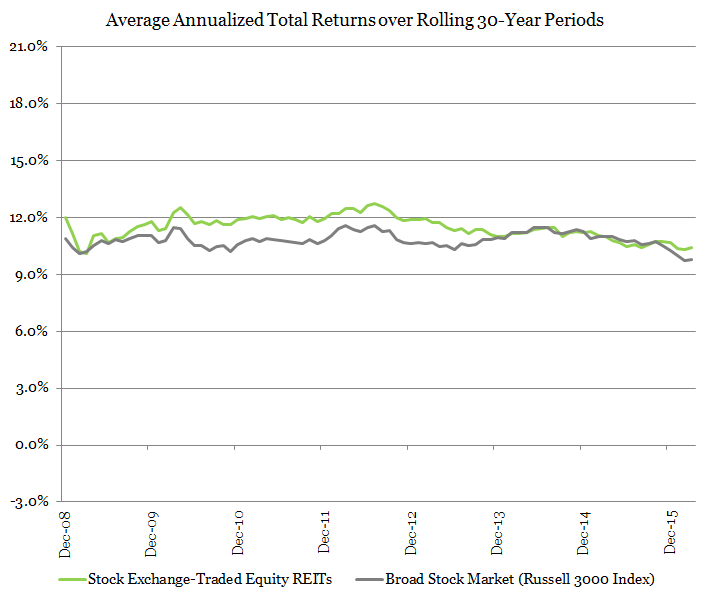
Finally, here’s another chart showing average total returns for rolling 30-year periods. This time the long-term average stock returns are actually slightly more certain than the long-term average REIT returns, with cross-sectional standard deviations of 3.4% for REITs, compared with just 2.1% for stocks. But the added certainty for stocks is not a good thing: Basically, it’s added certainty that stock returns would fall short of REIT returns. In particular, total returns of exchange-traded Equity REITs have usually averaged between 11.1 percent per year and 11.9 percent per year during the available 30-year historical periods, whereas total returns in the broad U.S. stock market have usually averaged between 10.6 percent per year and 11.1 percent per year. In fact, REIT returns outpaced stock returns during 82% of the available 30-year periods.
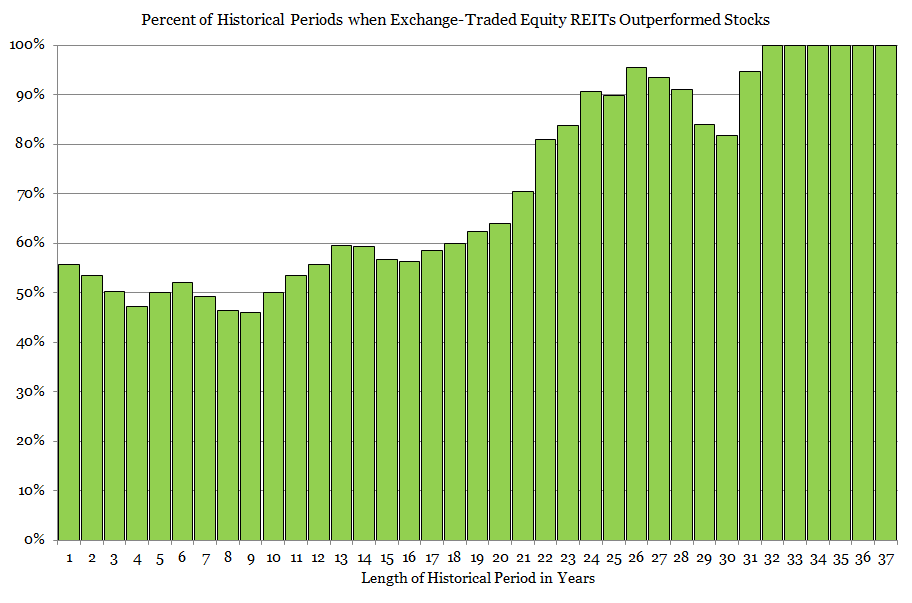
The last chart shows the share of long-term historical periods during which average total returns of exchange-traded U.S. Equity REITs exceeded those of the broad U.S. stock market. As I mentioned at the outset, REITs have typically outperformed the rest of the stock market over most periods of significant length. As the chart shows, REIT outperformance generally grows as the historical period lengthens: From around half of all relatively short historical periods (10 years or less) to more than 90% of most historical periods longer than 24 years. In fact, we have not yet seen any historical period of at least 32 years during which stock returns as measured by the Russell 3000 Index have outpaced REIT returns as measured by the FTSE NAREIT All Equity REITs Index.
If you’re a day-trader, average returns during long historical periods are irrelevant. Your hope is to be among the few traders accurately timing their moves into and out of individual stocks (or the market). But most of us—from the smallest individual investors building retirement wealth to the largest pension funds, endowments, and foundations building funds to cover benefits, financial aid and charitable activities—are looking to maximize returns in the next 10 years, 20 years, 30 years, or even longer. For those of us with long horizons, exchange-traded Equity REITs have proven themselves over and over again.