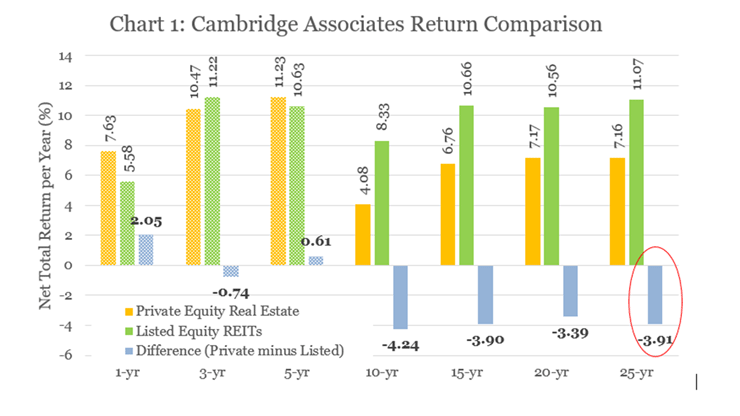
Cambridge Associates recently published the latest update of their “Real Estate Index and Selected Benchmark Statistics” summarizing private equity real estate fund performance through 2017Q1. Both their data and their analysis are terrific, but I had never before realized just how stunning their conclusions are: Cambridge Associates (C|A) reports that private equity real estate funds have underperformed listed equity REITs by 3.91 percentage points per year over the past 25 years.
Wow.
To put that into perspective, imagine you had a million dollars 25 years ago and you were deciding whether to invest it in the private equity funds that make up the C|A benchmark or in the stocks that make up the FTSE NAREIT All Equity REIT Index. If you had put it into private equity funds (and reinvested the net total returns) it would have grown to $5.6 million today, but if you had put it into listed equity REITs instead it would have grown to $13.8 million—nearly 2½ times as much!
C|A uses a “modified public market equivalent” (mPME) methodology, which is widely regarded as the only method that has yet been developed for making a good comparison between assets traded in liquid markets and similar assets that are not traded in liquid markets. They compare returns over several historical periods, as shown in Chart 1, where the shorter periods are shaded because C|A cautions that “performance metrics from [funds less than six years old] may be less meaningful.”
The C|A reports are “based on data compiled from 942 real estate funds (including opportunistic and value-added real estate funds), including fully liquidated partnerships, formed between 1986 and 2016.” They focus on net returns received by limited partners, and returns are measured at the fund level rather than at the property level. That’s relevant because opportunistic and value-added funds typically use dramatically greater leverage than listfed equity REITs, so lower fund-level returns must mean much lower property returns (plus higher expenses).
The now-defunct NCREIF/Townsend Fund Indices reported that average leverage for the funds in its sample during the available period 2007Q4-2013Q3 was usually between 51% and 56% for value-add funds and between 53% and 64% for opportunistic funds—but over the same period it was usually between only 36% and 47% for equity REITs. C|A doesn’t report average leverage for the funds in their benchmark, but they do report that “in terms of limited partners’ total paid-in capital, the C|A Real Estate benchmark is 71% Opportunistic and 29% Value-Added.”
So if private equity funds were using substantially greater leverage (as the available data suggest) but producing substantially lower returns at the fund level (as C|A reports) then they must have been producing even lower returns at the property level on top of their higher fees. Moreover, investors in private equity funds got hit not just by much lower returns, but also by much higher risk at the same time. The use of leverage increases volatility, relative to an unlevered investment, according to a simple mathematical formula:
- 41% leverage—the median value for the equity REIT industry during the 2007Q4-2013Q3 period—increases volatility by 69%. (As of 2017Q2 REIT leverage had fallen to an average of just 33%, which implies only a 50% increase in volatility.)
- 54% leverage—the median reported by Townsend/NCREIF for value-added funds over the same period—increases volatility by 117%.
- 60% leverage—the median for opportunistic funds—increases volatility by 150%.
On top of that, investors in private equity funds suffered pretty substantial additional risks because their investments were illiquid, meaning they couldn’t redeem shares at any price if they needed the cash. (Remember the payroll crisis that Harvard needed to get bailed out of because its endowment was so illiquid?) Academic researchers have estimated that investors need to get returns that are higher by something like 3% to 6% per year to compensate them for the risks of illiquidity—yet Cambridge Associates says they were getting returns that were lower by something like 4% per year.
There have been more than a dozen academic studies comparing the performance of listed and private equity real estate using different data sources, time periods, and methodologies, and all of them—every single one—has reached the same conclusion as Cambridge Associates: they all found better average performance on the REIT side, even after controlling for differences in the use of leverage, the mix of property types, and the geographic distribution of properties.
There’s a common rejoinder to this kind of comparison: institutional investors tend to believe that they have the ability to select and invest in only the “top-quartile” private equity funds, whereas (for whatever reason) they believe they have no such ability to select top-quartile investments in the public markets. Therefore—the argument goes—average REIT returns should be compared not with average private equity real estate returns, but rather with top-quartile private equity real estate returns.
While the merits of that argument are questionable (to say the least), the Cambridge Associates report enables us to do exactly such a comparison across several performance measures that are commonly used in the private equity world: internal rate of return (IRR), total value to paid-in capital (TVPI), and distributions to paid-in capital (DPI). It’s worth noting the problems with these metrics for evaluating performance: as Phalippou [2009] noted, for example, “IRR is probably the worst performance metric one may use in an investment context. It exaggerates the variation across funds, exaggerates the performance of the best funds, can be readily inflated and provides perverse incentives to fund managers.” But the numbers are striking enough to be informative anyway:
- The top quartile of private equity real estate funds from vintage year 1997 underperformed the average for listed equity REITs in terms of both TVPI and DPI, although they posted a significantly higher IRR. (As Phalippou noted, two of the problems of IRR are that it “exaggerates the performance of the best funds [and] can be readily inflated.”)
- For vintage year 1998, the top quartile of PERE funds underperformed the average for REITs according to all three measures.
- For vintage year 1999, the top quartile of PERE funds outperformed the average for REITs by all three measures, but just barely.
- For vintage year 2004, the top quartile of PERE funds underperformed the average for REITs according to both TVPI and DPI, and posted a higher IRR by just 0.08%, the smallest margin shown.
- For vintage years 2005 and 2006, the top quartile of PERE funds underperformed the average for REITs according to all three measures, and substantially so according to IRR and TVPI.
- For vintage year 2007, the top quartile of PERE funds underperformed the average REIT in terms of IRR and TVPI, and just barely edged out REITs in terms of DPI.
- For vintage year 2008, the top quartile of PERE outperformed the average for REITs by all three measures, but not very impressively.
In other words, during six of the 17 vintage years 1994-2010, even those real estate investors who correctly predicted which private equity investment managers would perform the best in their industry (and assumed much higher risks from both leverage and illiquidity) still did worse, according to at least one commonly used performance metric, than they would have if they had gotten nothing better than the average performance of equity REITs listed on stock exchanges—and during another two vintage years the outperformance by top-quartile PERE funds relative to the average for REITs was quite small.
Investors who are absolutely devoted to the private equity approach sometimes claim that they carefully choose when to commit their capital, to catch only the best years of PERE performance. That’s not actually how the private equity world works—investors typically follow a “vintage year diversification” approach, which reduces or eliminates that possibility—but there doesn’t seem to be evidence to support that argument anyway. The private equity data company Preqin, for example, has published reports indicating that fundraising for real estate funds that closed in 2010 (a vintage year when private equity real estate funds handily outpaced REITs according to the data from Cambridge Associates) was 64% less than for funds that closed in 2007 (a vintage year when private equity real estate funds underperformed REITs by C|A’s IRR and TVPI measures). So much for prowess in timing.
To summarize, what does private equity real estate investing offer?
- It’s not that they outperform listed equity REITs: the data from Cambridge Associates leads to the same conclusion as every single academic study, that private equity real estate funds have generally underperformed REITs.
- It’s not that investors can get better returns by selecting the top-quartile funds: even if they could (and there’s no evidence for that), the Cambridge Associates data suggests that REITs have frequently outperformed even the top quartile of private equity real estate funds.
- It’s not that investors can choose the best moments to invest in private equity real estate: data from Preqin suggest that they have had a greater tendency to choose bad years rather than good ones.
- And on top of all that, by eliminating the possibility of getting out of a bad investment, private equity funds expose investors to substantial illiquidity risks and costs for which they certainly have not been compensated.
Given C|A’s analysis, on top of other data that have been publicly available for years, it does seem reasonable to ask: What is it that private equity real estate funds offer?
By the way, if you have any comments or questions, or want my bibliography of academic studies comparing listed and private real estate, drop me a note at bcase@nareit.com.