September 2017 marks 8½ years since the beginning of the current real estate cyclical bull market. Numerous writers (including Nobel prize winner Robert Shiller, my dissertation advisor) have expressed concern that the broad stock market may have become overvalued, and others (including myself) have expressed concern that the private side of the real estate market may have ventured into the same territory. Exchange-listed equity REITs are the nexus of those two markets—where investors can get the returns of real estate through companies traded on stock exchanges—so it seems to be a good time to evaluate the current market cycle from the perspective of an investor in listed equity REITs.
From the outset you should keep in mind two important points: (1) REITs are not very like other stocks, and (2) REITs are real estate, but they’re not quite the same as private real estate. Here’s what I mean.
First, listed equity REITs differ substantially from non-REIT stocks—even though they’re traded through the same stock exchanges—because the primary drivers of returns for listed equity REITs come from the real estate market cycle, not the business cycle that drives returns for almost all other companies traded on stock exchanges. Since the beginning of 1972, when NAREIT started keeping track of REIT returns, the correlation in monthly returns between listed equity REITs and the S&P 500 has been 57%. Some people continue to make the mistake of claiming that listed equity REITs have recently become more correlated with the broad stock market, so let’s refute that once and for all. During the 2008-09 liquidity crisis the REIT/stock correlation did increase to about 80%, but over the past 5 years, the REIT/stock correlation has been just 46%. In other words, the correlation has been substantially lower since the Great Financial Crisis ended. So the fact that someone like Bob Shiller has argued that the stock market is overvalued doesn’t mean that the REIT market is overvalued.
Second, both listed equity REITs and private equity real estate are real estate investments—because the primary drivers of returns come in both cases from the real estate market cycle—but their reported values and returns can differ over short periods. The biggest reason for this is that it takes so long to deploy capital into the private real estate market that private-side investors tend to overshoot, continuing to shovel money into private real estate investments when they’re overvalued--an example of "irrational exuberance." Another problem is that values and returns simply aren’t measured very accurately in private markets, whether for private real estate or for private equity—in fact, there is evidence that some investment managers in the private equity market may even inflate their values and returns as a marketing tool. So the fact that someone like me has argued that the private real estate market is overvalued doesn’t mean that the listed REIT market is overvalued.
With that background, let’s compare the current real estate market cycle with previous ones, and then take a look at current listed equity REIT valuations.
I like to divide a market cycle into three phases: (1) the downturn from a peak to a trough, (2) the recovery back to the pre-downturn peak, and (3) the expansion from the end of the recovery to a new market peak. The complete real estate market cycle seems to have an average duration of about 18 years (a fact observed way back in 1933 by the great real estate market researcher Homer Hoyt), and we have good data for the two full real estate market cycles preceding the one we’re in now. Table 1 shows how they compare.
Table 1: Comparison of Three Real Estate Market Cycles
|
Peak-to-Peak Months |
September 1972 – August 1989 |
August 1989 – January 2007 |
January 2007 - present |
|
Complete Cycle Duration |
16 years 11 mos |
17 years 5 mos |
10 years 7 mos to date |
|
Complete Cycle Average Return |
13.9%/yr |
14.3%/yr |
4.6%/yr to date |
|
Duration of Downturn |
27 months |
14 months |
25 months |
|
Peak-to-Trough Severity |
-37.0% |
-23.9% |
-68.3% |
|
Duration of Recovery |
21 months |
5 months |
41 months |
|
Duration of Expansion |
155 months |
190 months |
61 months to date |
|
Trough-to-Peak Cumulative Return |
+1,339.5% |
+1,239.5% |
+409.7% to date |
|
Trough-to-Peak Average Return |
19.9%/yr |
17.3%/yr |
21.1%/yr to date |
|
Expansion Phase Cumulative Return |
+911.3% |
+1,022.1% |
+160.3% |
|
Expansion Phase Average Return |
18.7%/yr |
15.8%/yr |
9.7%/yr |
The severity of the 2007-09 downturn owed, of course to the fact that a normal cyclical bear market in real estate was followed by a financial crisis the likes of which only the oldest members of our society had witnessed. It took a full 41 months after the market trough for exchange-traded U.S. real estate to recover fully: it was not until the end of August 2012 that investors in listed equity REITs regained the portfolio values they had at the end of January 2007.
Over the 8½ years since the depth of the liquidity crisis (41 months of recovery plus 61 months of expansion to date), investors in listed U.S. equity REITs have taken home gross total returns averaging 21.1% per year. That sounds great—and it is—but it’s also perfectly ordinary: during the first 8½ years after the 1972-73 downturn listed equity REIT investors took home gross total returns averaging 24.5% per year, and during the first 8½ years after the 1989-1990 downturn their returns averaged 15.1% per year. (REITs were temporarily down at the end of that 8½-year period following the end of the 1990 trough because investors were reallocating their capital to tech stocks so they could participate in the dot-com bubble.)
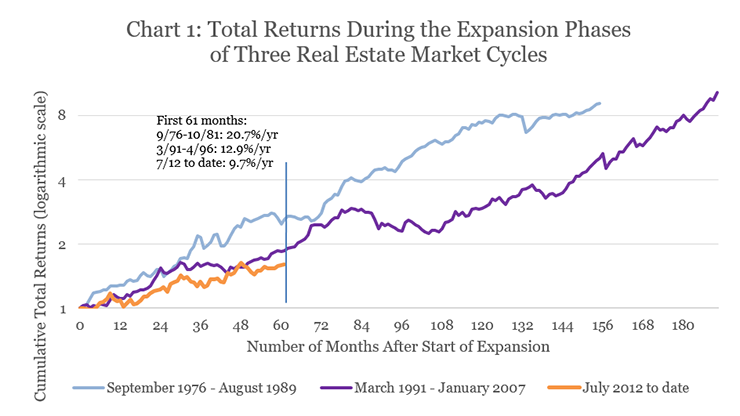
The big difference between the current bull market and the two previous ones is that the current bull market started from the depth of a liquidity crisis. Because of that, a more telling comparison is between returns during the expansion phases—that is, after investors had recovered fully from the downturn. For investors in the 1970s and 80s, the expansion phase that ran 155 months from September 1976 through August 1989 gave them total returns averaging 18.7% per year. For investors in the 1990s and 2000s, total returns during the expansion phase (190 months from March 1991 through January 2007) averaged 15.8% per year.
Today’s investors, though, haven’t yet reaped nearly the rewards they would ordinarily expect from a REIT expansion: total returns over the 61 months from July 2012 through August 2017 have averaged a relatively paltry 9.7% per year. In fact, as Chart 1 shows, during the first 61 months of the expansion phases of the past two cycles, total returns averaged a much higher 20.7% per year (September 1976 – October 1981) and 12.9% per year (March 1991 – April 1996).
In short, listed equity REIT returns averaging 21.1% per year over the past 8½ years look great at first—but they’re actually not as strong as it seems they should have been, in comparison with previous real estate upturns and given how severely the GFC hit.
Now let’s add some numbers about current valuations for listed equity REITs. As I noted earlier this year, the spread between average dividend yields for listed equity REITs and the yield on 10-year U.S. Treasury securities has historically served quite impressively as a signal for future listed equity REIT returns, both on their own and relative to the broad U.S. stock market. The same analysis that I described back then, but updated through the end of August 2017, suggests that—if historical patterns hold—one might expect listed equity REIT total returns to average something like 14.9% per year over the next three years, and to beat the broad stock market over that period by something like 4.6 percentage points per year. In other words, current conditions suggest that listed equity REITs may be substantially undervalued, even if the broad stock market turns out to be overvalued as Dr. Shiller warns.
Earlier this year I also published a market commentary showing how one can use an estimate of the average REIT stock price premium to net asset value (P-NAV) to predict returns on listed equity REITs, and the same analysis can also be applied to predict outperformance for listed equity REITs relative to the total returns on institutionally owned properties in the private real estate market. Updating that analysis through 2017Q2 suggests that—again, if historical patterns hold—returns to investors in the public (exchange-listed) part of the real estate market may exceed those measured by the NCREIF Property Index for the private (illiquid) part of the real estate market by something like 7.1 percentage points per year over the next five years.
Let me summarize what my empirical analyses suggest:
- The broad stock market may be overvalued—but listed equity REITs are not very like other stocks and seem to be substantially undervalued, especially relative to non-REIT stocks.
- The private real estate market may be overvalued—but listed equity REITs seem to be substantially undervalued, especially relative to private real estate.
- Listed equity REIT investors have benefited dramatically from the real estate bull market of the past 8½ years—but the current expansion has not really hit its stride yet.
By the way, if you have any comments or questions, drop me a note at bcase@nareit.com.