The past two weeks, I’ve published the first two in a series of commentaries summarizing “where we stand” in the market for equity real estate investment returns. The first two focused respectively on returns and correlations; this one focuses on volatilities, risk-adjusted returns, systematic risk (beta and alpha), and diversification benefits.
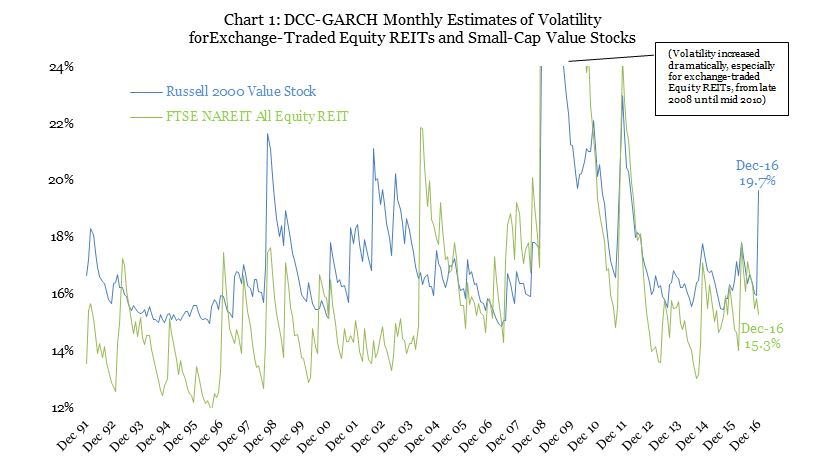
Exchange-traded REITs are usually slightly more volatile than the broad stock market, for two reasons: first because many REITs are smaller companies and smaller companies tend to be more volatile than larger companies, and second because the broad market encompasses a broad variety of companies whose stock price movements may offset each other. Over the 26 years since the end of 1990 (roughly the “modern REIT era”) the median annualized volatility of monthly total returns for exchange-traded Equity REITs, according to the same DCC-GARCH model that I use to develop up-to-date estimates of correlations, has been 15.2% compared to 14.4% for the Russell 3000 index of the broad stock market.
That’s no great surprise, but here’s something that may be more surprising to many investors: small-cap value stocks—which are comparable to many REITs in size and typically less volatile than their “growth” counterparts—have actually been more volatile than Equity REITs about 80% of the time since the beginning of the modern REIT era. (Independent academic researchers have tended to reach the same conclusion, especially following the 2008-09 liquidity crisis: one recent study, for example, found that “during the post-crisis period, REITs have higher liquidity, lower volatility, lower price impact of trades, and greater trading activity than non-REIT stocks of comparable market cap” and concluded that “their volatility and cost of trading has declined significantly, making them an attractive vehicle for adding diversification to any stock portfolio.”)
At the end of 2016, as Chart 1 shows, small-cap value stocks became especially volatile: the latest estimate of their annualized volatility was 19.7%, making them about 29% more volatile than Equity REITs. Keep in mind that small-cap value stock indices such as the Russell 2000 Value include many REITs, implying that the non-REIT constituents were more volatile than the index suggests.
Lower volatility than small-cap value stocks with comparably high returns, and higher returns than the broad stock market with comparable volatility, means that exchange-traded Equity REITs have typically provided better risk-adjusted returns (Sharpe ratios) than either the broad stock market or the small-cap value segment. For example, simple average monthly returns of 1.04% per month (12.44% annualized) over the 26 years since the beginning of the modern REIT era, combined with the 17.01% average monthly value of (annualized) volatility and the 0.20% average monthly risk-free rate of return (2.42% annualized) imply that REITs earned a Sharpe ratio of 0.589. The comparable Sharpe ratios for small-cap value stocks and the broad stock market were just 0.578 and 0.505, respectively.
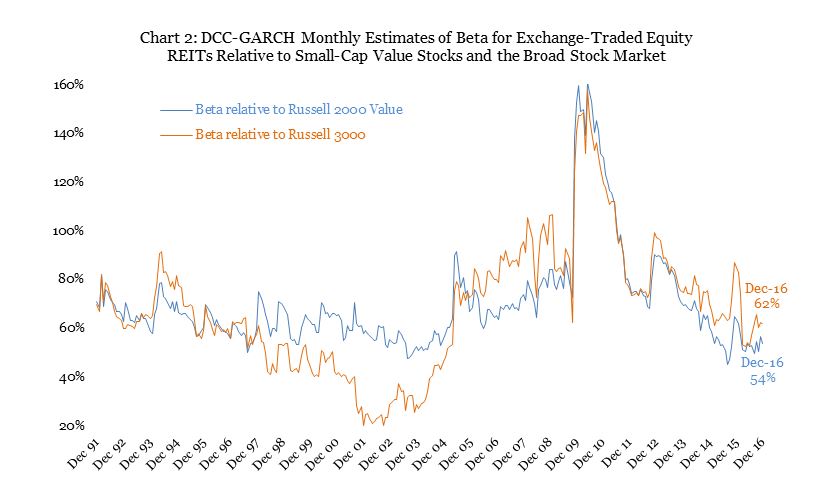
Because exchange-traded Equity REITs have typically offered higher risk-adjusted returns than either small-cap value stocks or the broad stock market with reasonably low correlations to both of them, REITs have typically provided strong diversification benefits to an existing stock portfolio. Beta for exchange-traded Equity REITs relative to the Russell 2000 Value stock index (according to the same DCC-GARCH model) has typically been between 0.58 and 0.73, but was exceptionally low at 0.35 at the close of 2016; relative to the broad market it has typically been between 0.52 and 0.82 and was normal at 0.67 to close the year. (Keep in mind that lower beta is generally good as it reduces the volatility of the combined portfolio.)
Their strong returns and low systematic risk mean that exchange-traded Equity REITs have typically provided very strong alpha relative to a stock portfolio: alpha has averaged +0.32% per month (+3.85% per year, ignoring fees) for a passively managed portfolio matching the FTSE NAREIT All Equity REIT Index relative to the Russell 2000 Value, and +0.42% per month (+5.04% per year) for the same portfolio of REITs relative to the Russell 3000 index of the broad stock market. Of course alpha was sharply negative during the liquidity crisis of 2008-09, but that tends to reinforce the strong risk-adjusted returns that exchange-traded Equity REITs have typically provided in more normal times, including the current environment: the median alpha during the modern REIT era, for example, has been even stronger at +0.56% per month (6.68% per year) relative to the broad stock market.
In summary, exchange-traded Equity REITs have a 26-year track record of having been slightly less volatile than otherwise comparable non-REIT stocks, with noticeably stronger risk-adjusted returns (even including the 2008-09 liquidity crisis!), plus low betas and positive alphas relative to the non-REIT parts of the stock market. The diversification benefits of exchange-traded Equity REITs relative to the non-REIT parts of the stock market have persisted throughout a long period encompassing an almost unfathomly severe downturn—yet they have almost never been stronger than they were as 2016 came to a close.