REITs generally own top quality properties located in major cities like New York, San Francisco, and Chicago. For example, roughly 65 percent of REIT holdings of office properties, by market value, are within “gateway” markets1. Positioning themselves in strong markets has served the industry well, and has almost certainly contributed to the returns that REITs have delivered to investors over the years. More recently, however, other markets have taken the lead, as office properties in many secondary markets have enjoyed greater demand and rising occupancy rates relative to office markets in gateway cities.
Let’s take a look at what’s driving these shifts, including the supply and demand conditions for office properties in gateway markets, secondary markets, and the other areas for which we have data2. We will also examine the fundamental forces that are underlying these developments, especially the differences in growth of population and employment across various regions. REITs have focused their acquisition activity over the past five years in the secondary markets, areas that enjoyed the most robust employment and demand for office space, as they apparently anticipated the improvement in fundamentals that is boosting performance in these markets.
Supply and demand conditions
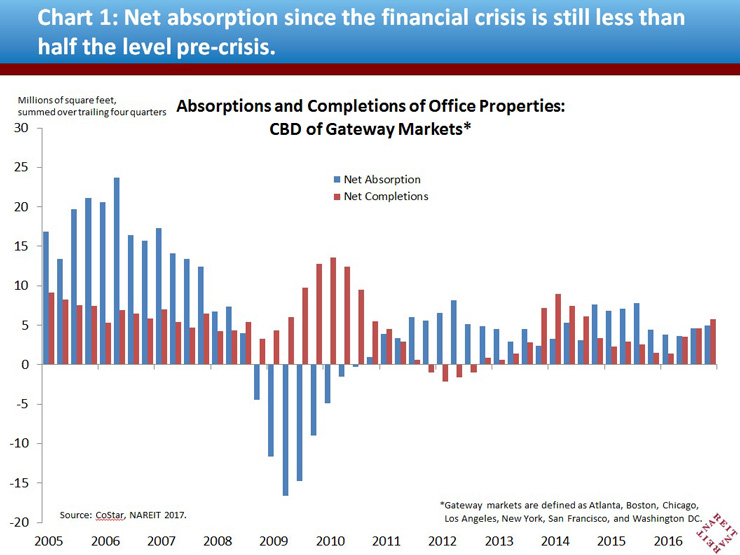
Before the financial crisis erupted in 2008, net absorption (demand) outpaced net completions (supply) of office properties in gateway markets by a wide margin (Chart 1). Despite some recovery since 2011, however, demand has still not returned to pre-crisis levels, and is in fact only about half of the level it was in the years before the financial crisis. This trend is true for both the central business district (CBD) and the suburban areas of gateway markets.
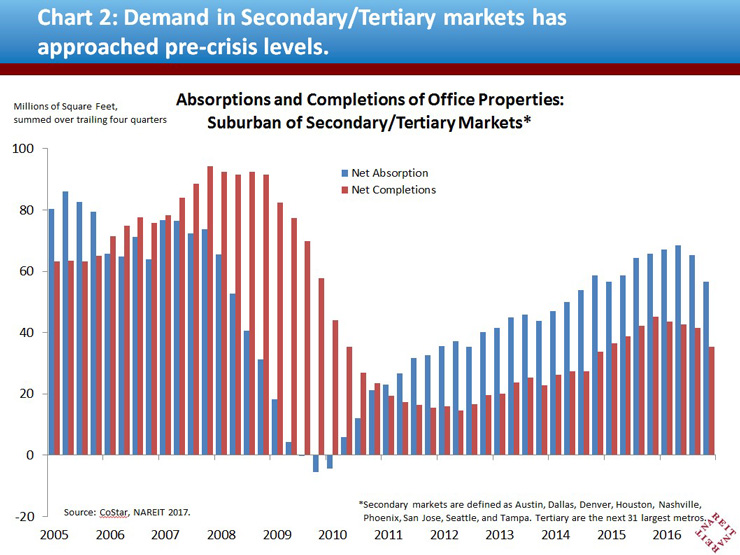
The secondary and tertiary markets, in contrast, have shown a stronger recovery in demand than the gateway markets. Demand in secondary/tertiary markets has been growing consistently since 2011, and is nearly back to its pre-crisis levels (Chart 2). In addition, much less office space has entered the market compared to the prior cycle, which has allowed for demand to remain well ahead of supply.
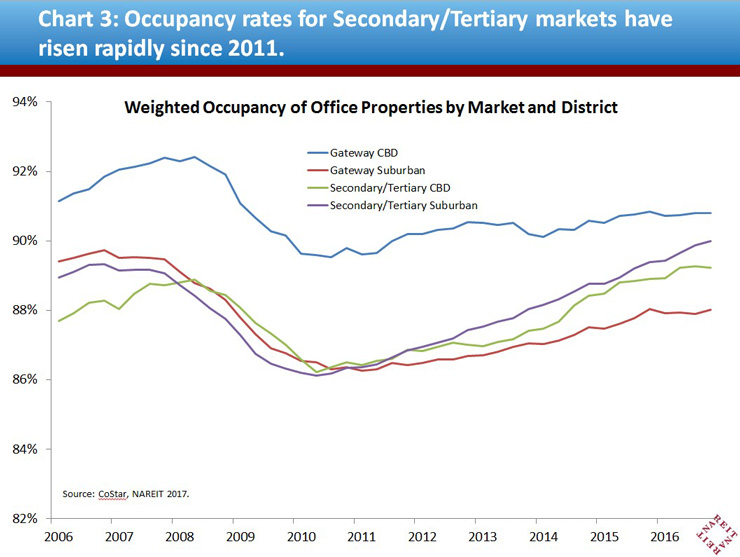
The excess demand over supply in these secondary and tertiary markets has pushed occupancy rates up at a faster pace, compared to gateway markets. Properties in the gateway CBD markets prior to the financial crisis enjoyed occupancy rates that were three percentage points, on average, higher than in suburban, secondary, or tertiary markets. This differential remained in place through the crisis and until 2012. Since then, however, secondary markets have steadily gained ground, and by early 2017, the gap in occupancy rates between gateway CBD office markets (blue line) and secondary/tertiary suburban markets (purple line) had narrowed to less than 1 percentage point (Chart 3).
Economic fundamentals in the Gateway, Secondary, and Tertiary markets
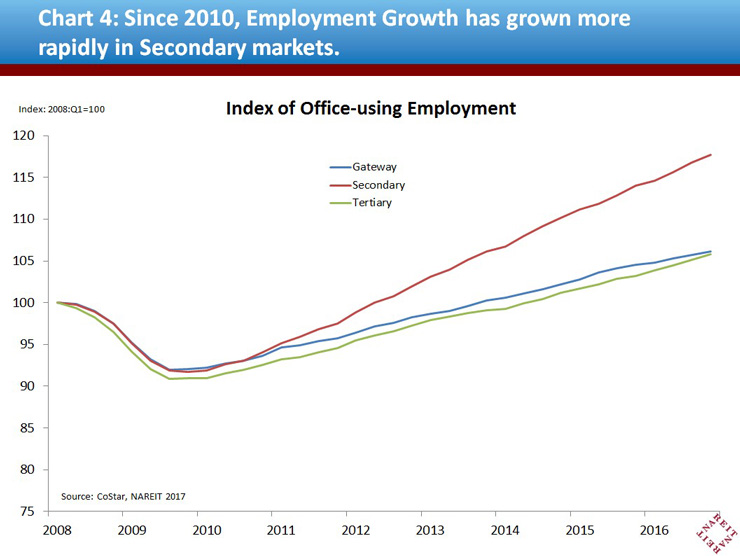
Solid economic fundamentals, in particular the increases in population and employment, have driven the growing demand and occupancy rates within secondary markets. The chart below (Chart 4), shows an index for office-using employment for each market. Starting in 2011, employment in the secondary markets has grown more rapidly than the gateway or tertiary markets. By the end of 2016, employment in the secondary markets stood 17 percent above pre-crisis levels, more than triple the net gains in employment in gateway and tertiary markets of just 5 percent.
Portfolio activity by REITs
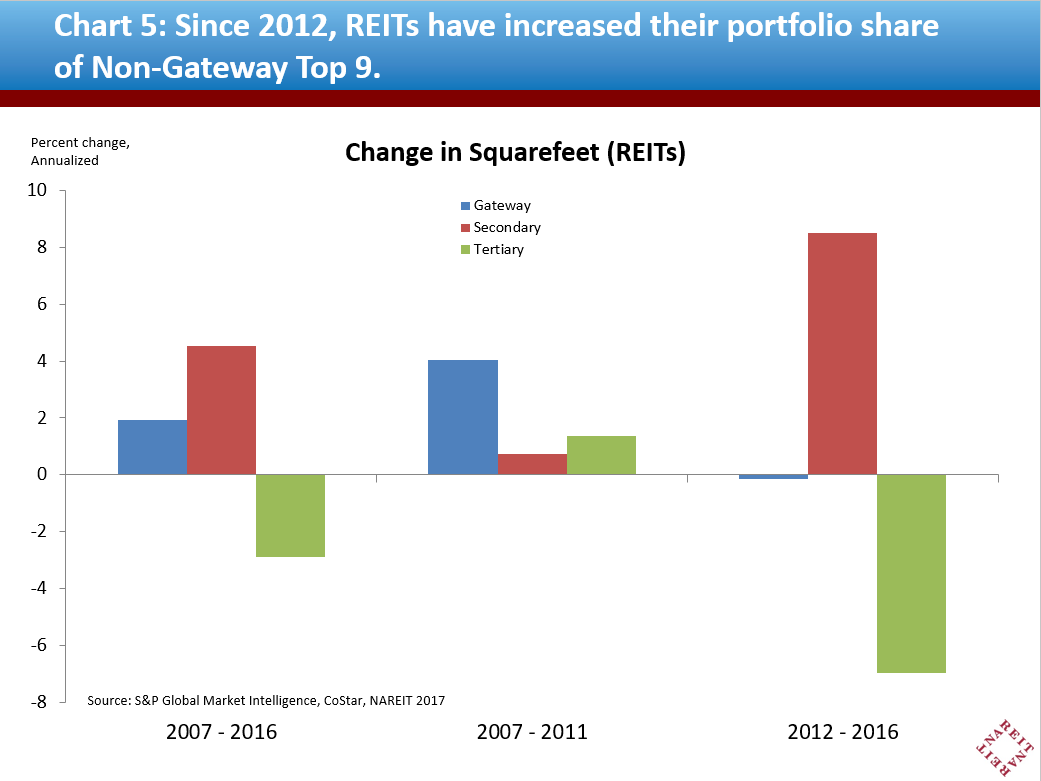
REITs overall began shifting their property portfolios as early as 2013 in order to benefit from these improvements in fundamentals and the increasing demand within secondary markets. Over the ten-year period from 2007-2016, REIT office properties, in terms of square feet, in secondary markets have increased at an average annual pace of 4.5 percent, more than twice as rapid as in gateway markets (Chart 5, red bar in the first set of bars). There was a significant shift in the geographic pattern of net purchases, however, during this ten year period. From 2007 through 2011, REITs focused their growth in office markets in gateway cities (blue bar in the second set of bars). Since 2012, however, REIT holdings in secondary markets have increased at an average annual rate of 8.5 percent (red bar in the third set of bars). REIT properties in gateway cities, in contrast, were essentially unchanged, while holdings in tertiary markets fell sharply. REITs appear to have anticipated that the secondary markets would enjoy stronger fundamentals that boosted occupancy rates compared to other metro areas.
Macroeconomic fundamentals have helped make secondary markets more attractive to investors since the end of the financial crisis. REITs responded by acquiring properties within secondary markets to help deliver higher returns to their investors. Their ability to take timely action, based on emerging trends in fundamentals, demonstrates REIT’s knowledge of the sector and how they make use of such knowledge in pursuit of higher returns.
1 Gateway markets are defined as Atlanta, Boston, Chicago, Los Angeles, New York, San Francisco, and Washington DC.
2 Secondary markets are defined as Austin, Dallas, Denver, Houston, Nashville, Phoenix, San Jose, Seattle, and Tampa. Tertiary are the next 31 largest metros.
3 Calculated by NAREIT using CoStar data.