Alex Beath, senior research associate at CEM Benchmarking, an independent provider of benchmarking information for institutional investors, has been working with Nareit for more than a decade to better understand the realized investment performance of defined benefit (DB) pension funds across asset classes.
CEM Benchmarking’s 2022 study, sponsored by Nareit, looked at investment performance across asset classes over a 23-year period (1998-2020) using a unique dataset covering over 200 public and private sector DB pensions with nearly $3.9 trillion in combined assets under management.
What are some of the main ideas that have emerged from your research?
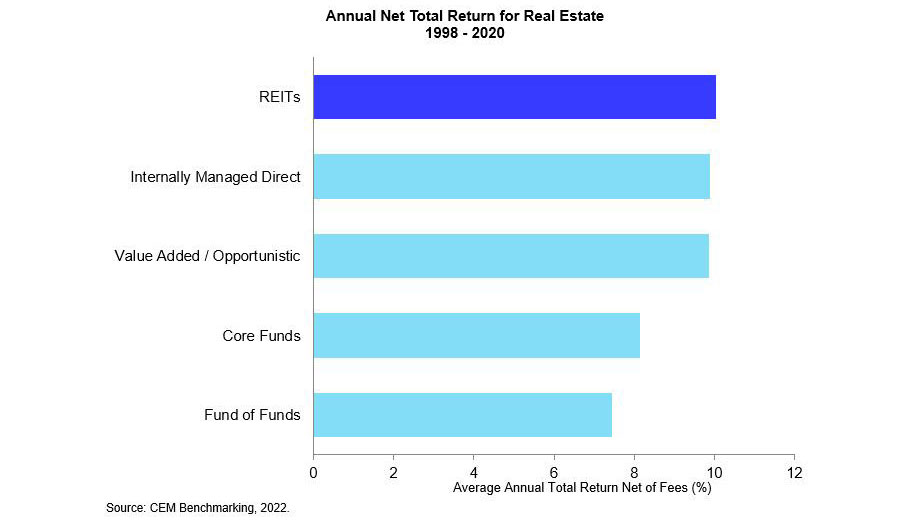
CEM’s key findings underscore that REITs and private real estate have highly correlated returns—once the lag of private real estate appraisals is taken into account. At the same time, fees associated with non-listed real estate ultimately result in listed equity REITs outperforming by around 2%.
The 10 year anniversary of the research fell during an interesting time for institutional investors, with the latest study period ending in 2020. Most public market assets had a tough year in 2020, many seeing large, double-digit negative returns during the spring as the COVID pandemic took the world by storm.
The situation, however, posed a rigorous test of a primary conclusion of the research, but one that hadn’t had a vigorous test since 2008. The conclusion is this: private markets lag public markets but are otherwise similar in the behavior of their returns (e.g., are correlated, have similar risk).
For example, non-listed real estate returns, which are mostly reported on an appraisal basis, aren’t obviously correlated to listed equity REIT returns, which are reported on a mark-to-market basis, even though both invest in fundamentally same market, namely real estate. But, if you account for the lag in the appraisals, it’s clear that the two ways of investing in real estate provide similar streams of returns with a few notable differences.
What steps were involved in accurately comparing listed and non-listed real estate returns?
As our data is annual, it’s not always clear that a market has had a volatile year (consecutive volatile years can have similar returns). For example, listed equity REIT portfolios, most of them actively managed, posted a return of over 21% in 2019, but a return of negative 4% in 2020. Non-listed real estate by contrast, posted a return of only 5% in 2019 and were flat in 2020.
While these two streams of returns don’t look correlated, because non-listed real estate lags listed equity REITs, either six to eight months or 14 to 16 months depending on when and how individual portfolios are valued, the two streams of returns cannot be compared. To compare them properly, you need to remove the lag. Doing so shows that non-listed real estate portfolios actually had a good year in 2019, with a return comparable to listed equity REITs at 19% followed in 2020 by a return of negative 3%.
In the end, non-listed real estate experienced similar volatilities as listed REITs, but that averaging appraisal based returns smooths that volatility away. Some see this smoothing and lag in private markets as a benefit, as it removes volatility from a fund’s total return. But as Charlie Munger once said, “that’s a silly reason to buy something.”
What’s the ultimate impact of investment costs?
There are many good reasons pension funds should invest in real estate–correlations to equities and fixed income are low, the asset class acts as an inflation hedge, and if costs are managed well, returns have been historically high.
However, costs in non-listed real estate are not always managed well. Whereas investments in actively managed listed equity REIT portfolios are measured in the 10s of basis points, many non-listed real estate portfolios can cost 100s of basis points; in the case of fund of funds, expressed as a fraction of net assets, costs can easily approach or exceed 500 basis points.
Investment costs negatively impact investment returns. The average cost of investing in non-listed real estate was 111 basis points whereas the average cost of a REIT portfolio was 49 basis points. It is our belief at CEM that the long-term underperformance of non-listed real estate relative to listed equity REITs, a difference of around 2%, all with similar volatility and correlation to other asset classes, is in part due to this cost differential.
How did CEM Benchmarking’s partnership with Nareit initially come about?
A little more 10 years ago, I had the pleasure of meeting two now retired representatives from Nareit, former EVP for Research & Investment Affairs Michael Grupe and former Senior Economist Calvin Schnure, at our office in Toronto. They came with a proposition; would we be interested in publishing top-level summary statistics on the asset allocations, asset class returns, and other performance metrics of defined benefit pension funds in the United States?
CEM Benchmarking had developed a rich database of asset allocations and performance metrics almost by accident. Our core mission has been benchmarking investment cost for our clients, hundreds of large global institutional investors, and less so their performance. At that time, we rarely made data available to the public.
What began as a proposition is now an annual tradition, with Nareit sponsoring the research but remaining at arm’s length, allowing the chips to fall where they may. If the same research had been done with another sponsor, listed equity REIT data would likely have been hidden, aggregated (incorrectly) with U.S. equities.