For REIT investors 2017 turned out to be a very normal year—but that was a huge disappointment given the “irrational exuberance” that investors in some other parts of the stock market enjoyed. Total returns for REITs (the FTSE Nareit All REIT Index) averaged +9.27 percent, just slightly less than the long-term average of +9.72 percent per year over the 46 years since Nareit started the index. That’s fine, but it didn’t compare with the fabulous +30.21 percent for large-cap growth stocks (Russell 1000 Growth), much less the +38.83 percent for large stocks in the information technology sector (S&P 500 Info Tech).
Many market participants, sensibly fearing that the “irrational exuberance” of 2017 has begun to look very much like the dot-com bubble for which that phrase was originated, have stepped up their search for assets that may have been overlooked and become undervalued. With evidence that real estate operating fundamentals are likely to continue to be strong for several years into the future—but with REIT returns having been stuck in “normal” gear while their underlying return drivers have been firmly in “expansion”—REITs are an obvious place to look for assets that are likely to outperform going forward.
So how can we develop empirically-based REIT return expectations for 2018?
Investors can use any of several models to determine whether REITs are undervalued or overvalued. Among other methods, they can estimate the value of each REIT’s properties and compare its stock price to the per-share value of its asset portfolio net of debt and other liabilities (the P-NAV method) or they can predict each REIT’s funds from operations over the next year to form an earnings valuation ratio (the P/FFO method). I prefer a method that is simpler but that has proven to be remarkably dependable in the past: comparing REIT dividend yields to the yields on other investments that, like REITs, provide strong and steady income streams.
As an example, as of the beginning of January 2018 the average dividend yield for equity REITs was 3.94 percent according to the FTSE Nareit All Equity REIT Index. Since the beginning of 1990 there has been a remarkably consistent relationship—with a correlation of more than +90 percent—between equity REIT dividend yields and the market yields on Baa-rated corporate bonds as tabulated by Moody’s. Baa-rated bond yields have typically been about 130 basis points higher than equity REIT dividend yields, and the spread between them has usually been between 80 and 180 basis points. As of the beginning of January, though, the Baa-rated corporate bond yield was just 4.23 percent, meaning that the REIT-Baa spread was extraordinarily small at just 29 basis points.
Deviations from the historically normal 80-180 bp spread between REIT dividend yields and Baa-rated corporate bond yields have generally provided a surprisingly reliable valuation signal and a surprisingly reliable predictor for future performance. The reason is simple: given the extremely steady pace of REIT dividend distributions, major changes in the yield spread arise primarily because REIT stock prices have been driven too high or too low relative to their future performance expectations.
- When the yield spread has been in its normal range—with Baa corporate bond yields between 80 and 180 basis points greater than REIT dividend yields—over the next year REIT total returns averaged 13.47 percent and outpaced the broad stock market (Russell 3000) by an average of 2.63 percentage points.
- At times when the yield spread was greater than 180 basis points—that is, when REIT dividend yields were extraordinarily low, reflecting REIT stock prices that were especially high relative to their current distributions—REIT performance over the next year tended to be weak, with total returns that averaged 6.98 percent and underperformed the broad stock market by 1.84 percentage points.
- At times when the yield spread was less than 80 basis points—when REIT dividend yields were extraordinarily high, reflecting REIT stock prices that were especially low relative to current distributions—REIT performance over the next year tended to be especially strong, with total returns that averaged 20.81 percent and outpaced the broad stock market by 5.67 percentage points. That, folks, is where we are now.
- To take the extreme case, it’s very rare for the Baa-rated corporate bond yield to be less than the average REIT dividend yield: that has happened only at times when investors were most dramatically avoiding REITs, most recently in March 2009 at the lowest point of the Great Financial Crisis—and in the 12 months following that episode, those investors who bucked the market and bought into REITs were rewarded with total returns that exceeded 100 percent.
The historical data can also be used in a regression, as shown in Chart 1. The yield spread (shown in grey) was extraordinarily high—in fact, it was positive at +0.51 percent—at the end of 1999, a time much like today when REITs had become “overlooked and undervalued” as the tech stock bubble inflated relentlessly. The regression predicted extraordinarily high returns for REIT investors over the next 12 months at +29 percent—and indeed investors who bought in to REITs at that time were rewarded with total returns averaging +26.37 percent that outpaced the broad stock market by 33.83 percentage points.
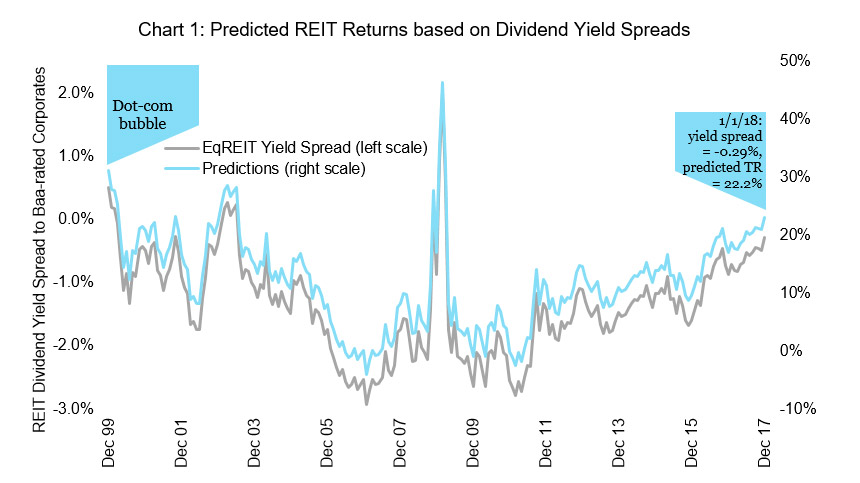
As the tech bubble burst and investors rediscovered REITs, the REIT dividend yield spread to Baa-rated corporates declined steadily until it reached its lowest value of -2.94 percent at the end of January 2007. At that level REIT total returns over the next 12 months were predicted to be negative and to underperform the broad stock market—and both predictions were true, although the model failed to predict the severity of the downturn with REIT returns of -23 percent underperforming the stock market by 20 percentage points during those 12 months.
The right edge of Chart 1 shows the most current prediction from the regression model. If the historical relationship continues to hold, then the dividend yield spread of just -0.29 percentage points as of the middle of December 2017 would translate to REIT total returns of 22.18 percent over the next 12 months and to REITs outperforming the broad stock market by 6.68 percentage points.
An investment strategy of bucking the rest of the market—looking for undervalued assets when other market participants have become captivated by the latest “unicorn”—has proven itself time and time again: if the crowd has rushed in then the crowd’s assets will be overvalued, so if you separate yourself from the crowd and focus on a strong operating environment instead, you will almost certainly find assets that have become “overlooked and undervalued.” In the current market situation, that certainly describes REITs.
If you have any questions or comments, please drop me a note at bcase@nareit.com.