REIT allocations in generalist funds, funds that don’t specialize in a particular sector or theme, tend to be underweighted by active managers. For funds benchmarked to popular indexes, the average active allocation is smaller than the passive allocation from the benchmark. However, this REIT underweight has been narrowing over time. The REIT underweight for generalist funds benchmarked against the S&P 500 declined from 114 basis points in 2016Q4 to just 62 basis points as of 2021Q2.
The gap between the benchmark and the active funds’ allocation to real estate is calculated using Morningstar Direct data on the share allocated to equity in the real estate GICS sector (which is nearly all REITs) for U.S. registered mutual funds and ETFs tied to major benchmarks. Chart 1 shows the REIT underweight trend from 2016 to 2021 for generalist funds benchmarked against a number of widely used indexes. The active allocation weight for each benchmark index is the asset-weighted average of active funds benchmarked to that index.
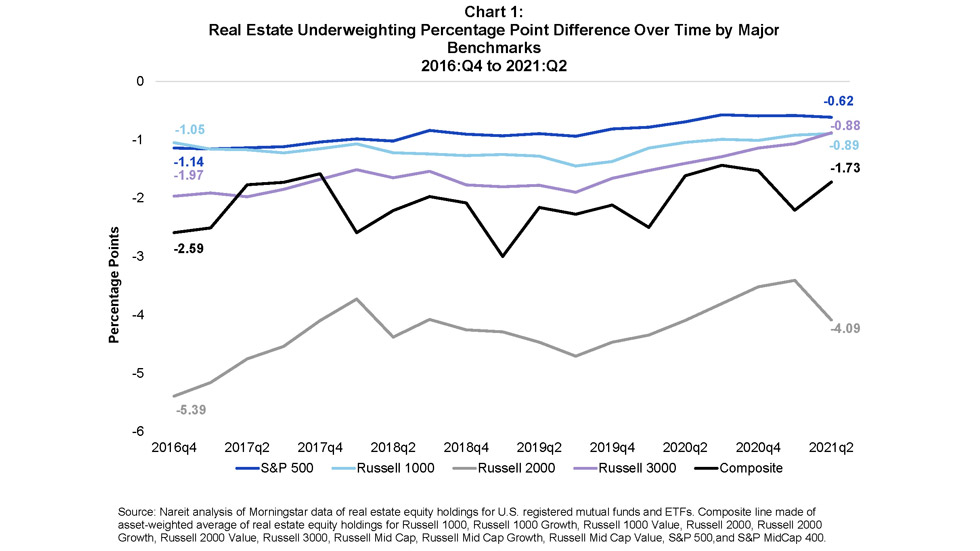
The average allocation to real estate in actively managed funds and their benchmarks has narrowed over the period. A composite of funds benchmarked to major indexes, including growth and value style funds, shows the overall trend in the chart. Small cap, growth, and value funds exhibit more variation in their assets than large cap indexes and therefore more variation in their REIT percentage allocations. The composite represents 12 benchmark indexes and over 1,600 active funds with $6 trillion in assets at the end of the second quarter. The composite was underweight in REITs by 259 basis points at year-end 2016 improving to 173 basis points at 2021Q2.
- The S&P 500 index result reflects 563 actively managed funds benchmarked to the index with $3.1 trillion in assets under management in 2021. As noted above, S&P 500 funds have the narrowest gap between the REIT allocation and benchmark weights in 2021Q2 and the REIT underweight has declined from 114 basis points as of year-end 2016 to 62 basis points in 2021.
- The FTSE Russell 1000 index result reflects 65 actively managed funds with $155 billion in assets under management. The FTSE Russell 1000 funds have the narrowed the REIT underweight from 105 basis points as of year-end 2016 to 89 basis points in 2021.
- The FTSE Russell 2000 result reflects 140 actively managed funds with $210 billion in assets under management. The FTSE Russell 2000 has the most variation in fund allocations to real estate and the largest improvement in the REIT underweight. The REIT underweight fell from 539 basis points as of year-end 2016 to 409 basis points in 2021.
- The FTSE Russell 3000 index result reflects has 106 actively managed funds with $219 billion in assets under management. Representing both small and large cap funds, the FTSE Russell 3000 funds had a larger REIT underweight in 2016 than the Russell 1000 and the S&P 500 at 197 basis points. Over the time period, the Russell 3000 underweight fell to roughly parity with the Russell 1000 at 88 basis points in 2021.