The sustained rise in prices of commercial real estate over the past seven years has prompted questions whether valuations may be getting ahead of themselves. Most recently, the Federal Reserve warned in its latest Monetary Policy Report of valuation pressures in commercial real estate markets.
Let’s take a look at four measures of valuations in commercial real estate:
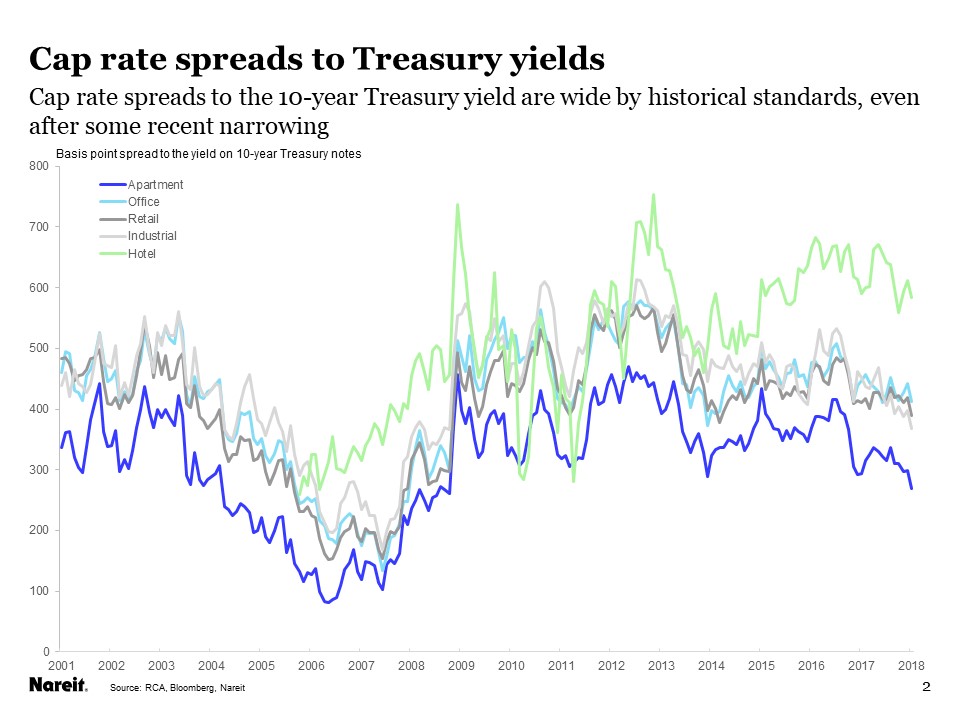
- Cap rates and cap rate spreads to yields on Treasury securities;
- Price gains, and whether such gains are driven by rising net operating income (NOI) or declining cap rates;
- Economic fundamentals, including occupancy rates and growth of demand; and
- Leverage and debt growth.
None of these measures is flashing a warning signal, suggesting that commercial real estate prices remain on solid ground.
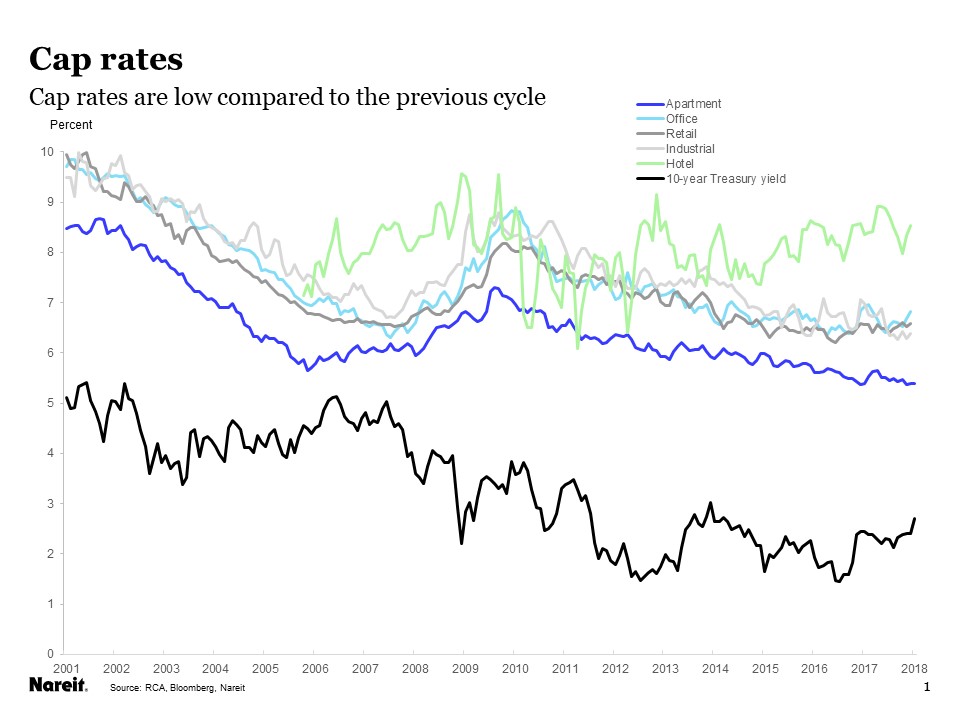
Cap rates are low, but so are yields on nearly every type of financial asset. Cap rates have drifted downward since 2010, and for most property types are at or near their lows for the past decade. Cap rate spreads to Treasury yields, which measure how much investors are compensated for potential risks in holding commercial real estate, are wider than they had been during the 2004-2008 boom period, though, and have narrowed only slightly in recent months. There is ample room for spreads to compress as interest rates move higher, which suggests there may be little pressure on property prices as interest rates rise.
Property prices have risen steadily, although gains have decelerated from the rapid pace in 2013-2015. In order to evaluate whether or not these price gains indicate an overheating market, it is important to analyze how much of the rise is attributable to improved fundamentals. Increases in prices can be separated into those that result from rising NOI versus those associated with falling cap rates. History has shown that price increases supported by NOI growth are more durable in the event of future shocks to the market. The next four charts show for the major property types price increases in the black line, the contribution from NOI growth in dark blue bars and contribution from cap rates in light blue bars.
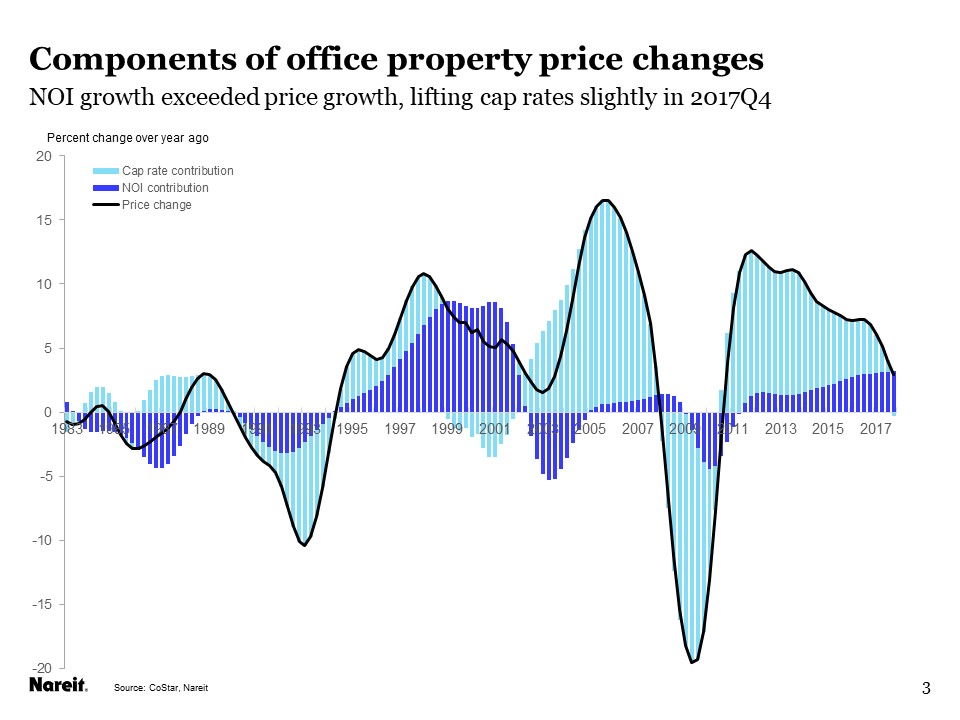
Office properties saw cap rates edge higher in the fourth quarter. The rise, however, came because NOI growth over four quarters accelerated to a slightly faster pace than the rise in prices. Moreover, price gains have decelerated from the double-digit pace of a few years ago, to the low- to mid-single digits. This more moderate pace of price increases, fully supported by higher NOI, does not appear frothy, as it is solidly based on fundamentals.
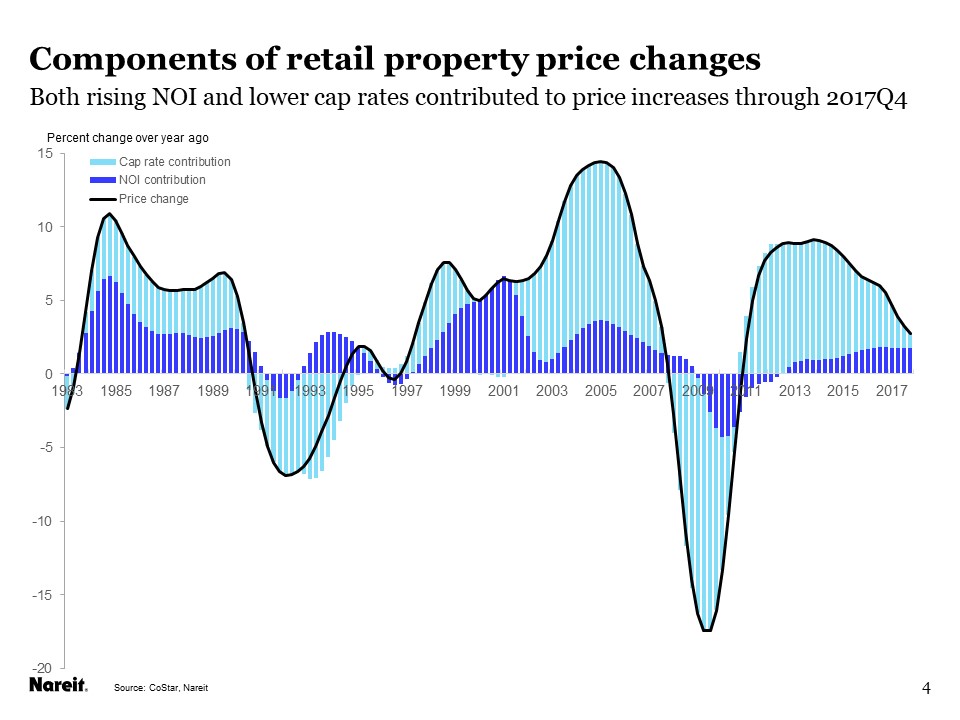
Retail property price increases were driven primarily by higher NOI, but also with some contribution from cap rate compression. NOI growth has not been rapid in this sector, but has edged gradually higher to nearly 2 percent over the past four quarters. Prices of retail properties have risen more slowly than most other property types, and recent increases appear to be aligned with improving fundamentals.
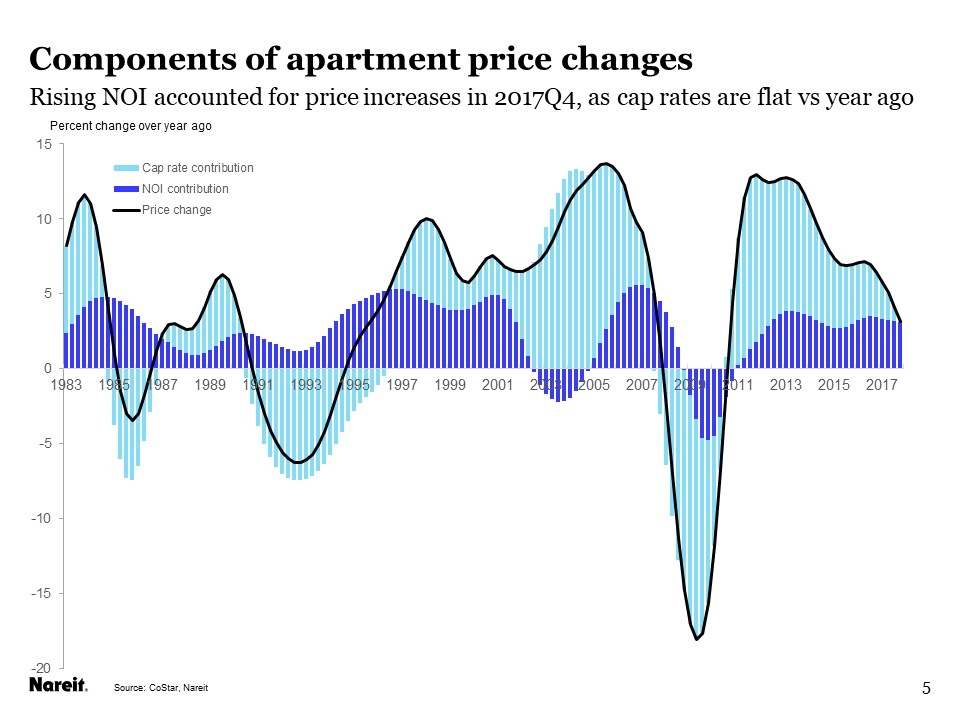
Apartment properties had steady cap rates as price increases matched NOI growth over the past four quarters. NOI growth has been steady in this sector as demand has been firm, even as a wave of newly constructed units have become available.
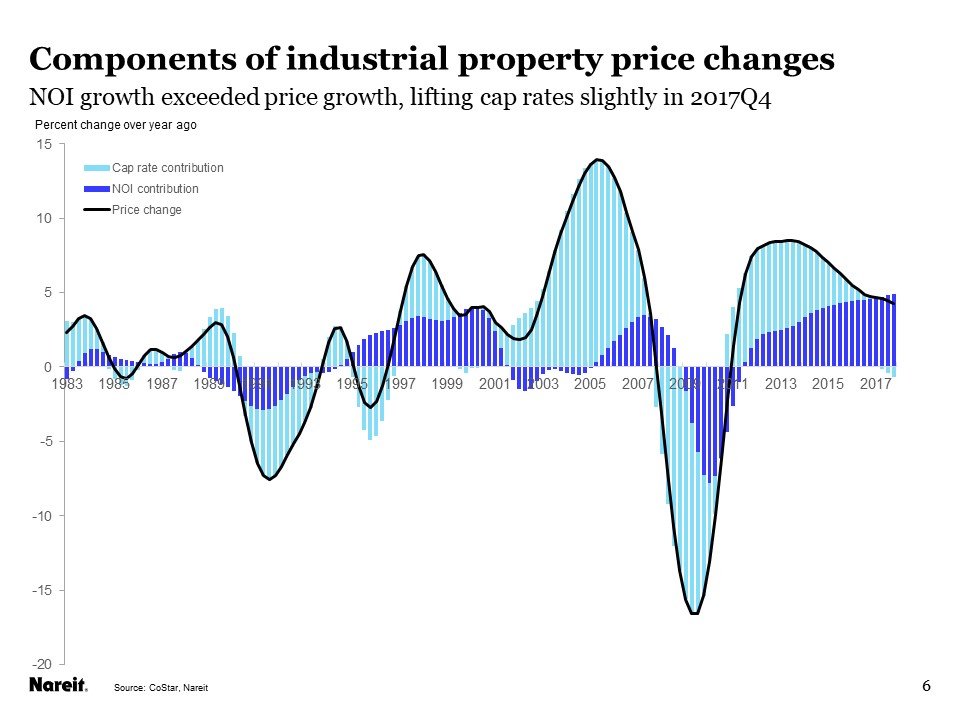
Industrial properties experienced accelerating NOI growth, to nearly 5 percent over the past four quarters. Cap rates were up slightly, reflecting price growth that was slower than this increase in NOI. This is a “best case” scenario of how cap rates can rise even with higher property prices, so long as NOI growth is maintained.
The main property sectors all have price increases mostly or completely supported by higher NOI, suggesting that valuations are not getting ahead of fundamentals.
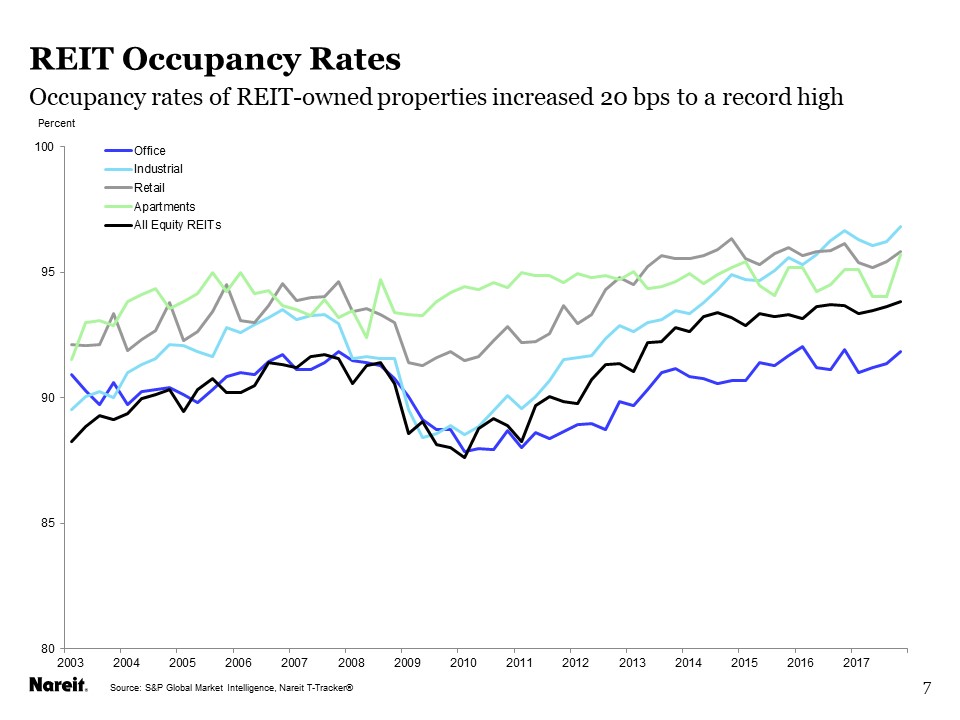
Economic fundamentals like supply and demand, and occupancy rates, are favorable. Occupancy rates of the major property sectors are at or near the highs for this cycle, according to data from CoStar. Among properties owned by REITs, the picture is even more favorable, as occupancy rates have risen to the highest in over two decades.
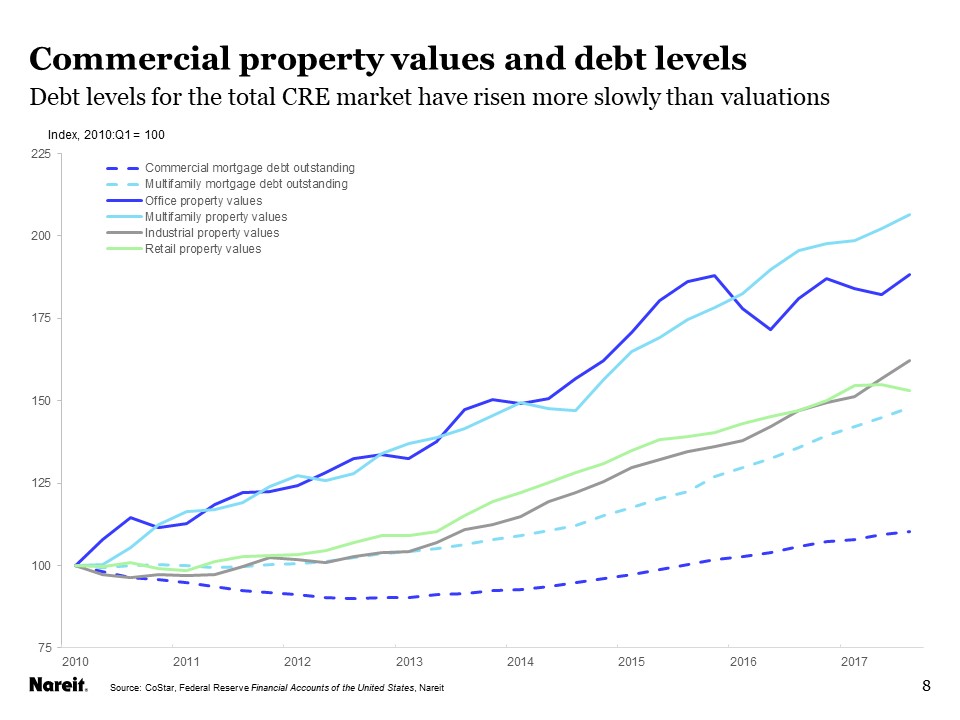
This is not a debt-fueled real estate cycle. In fact, if anything, lenders and property owners alike have reduced reliance on debt and raised equity capital to finance property holdings. For the commercial real estate market as a whole, mortgage debt outstanding (MDO) has risen slowly since the end of the financial crisis. Multifamily MDO has risen slightly less than 50 percent from the beginning of 2010 through 2017:Q3, while the valuations of multifamily properties have more than doubled (dashed and solid light blue lines). Commercial mortgage MDO has increased only 10 percent over this period (dark blue dashed line), while valuations of retail, industrial and office properties have risen between 50 percent and 90 percent (green, grey and dark blue lines). Aggregate leverage in real estate markets has declined on a mark-to-market basis, as valuations have risen far more than have the levels of debt financing.
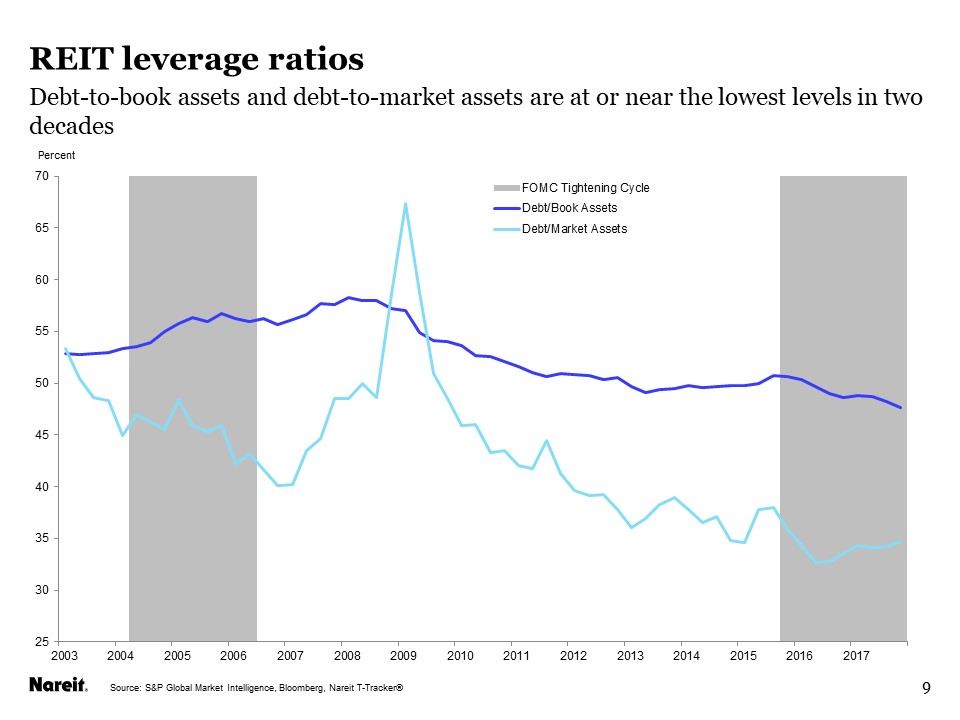
REITs have strengthened their balance sheets and reduced leverage by relying heavily on equity capital to finance their property holdings. The weighted average debt-to-book assets leverage ratio of REITs has declined more than 10 percentage points from its pre-crisis peak of 58.3 percent to a record low of 47.6 percent at the end of 2017 (blue line). The market leverage ratio, which substitutes market cap for shareholders’ equity in the denominator, is slightly above the low point reached in mid-2016.