I’ve noticed an uptick in the number of people who seem to be concerned about an increase in the inflation rate, and the number of people who have inquired whether real estate—and REITs in particular—provide “a hedge against inflation.” Of course there is substantial disagreement as to whether we are at imminent risk of increased inflation, but the concern is that tightness in employment markets may drive up wage growth, which could then drive up the price level. So I thought it would be a good time to review the historical evidence on the relationship between high inflation and REIT returns.
I typically don’t use the word “hedge” when talking about inflation, because essentially no investors (not even the largest and most sophisticated) literally set up a hedge to protect against inflation. Loose talk about “hedging” seems to have enticed many supposedly sophisticated investors into asking the wrong questions, doing the wrong empirical analyses, and investing in the wrong assets.
If what you’re going to do is set up a hedge, you need to compute a hedge ratio, which is based on the correlation between the risk you’re trying to hedge against (inflation) and the returns that will help you offset it. Inflation is reported monthly, so common practice is to compute the correlation between monthly inflation and monthly returns. Only one common asset has an especially high contemporaneous correlation with monthly inflation, and that’s energy-related commodities. (No surprise there: the main input that determines the monthly inflation rate is that month’s change in energy prices.)
As I said, though, essentially nobody actually sets up a hedge against inflation: instead, investors who are concerned about high inflation invest in assets whose returns can be expected to exceed inflation even when it is high—that is, they look for assets that typically provide positive real returns even in high-inflation environments. Moreover, they don’t care whether real returns are positive during each month of high inflation—returns that catch up with inflation fairly quickly, and thereby preserve purchasing power over slightly longer periods, are just fine.
If that describes you—that is, if “hedging” doesn’t literally describe your approach to inflation protection—then a correlation coefficient can lead you badly astray. Chart 1 shows what I mean. From the end of 1974 until the middle of 1982 inflation was truly terrible, averaging 8.6 percent per year and never dipping below 4.9 percent for any 12-month stretch. For investors living in the hypothetical world of inflation “hedging,” the hedging asset (light blue line) represents the dream, with an absolutely perfect 100 percent correlation with monthly inflation, while the protecting asset, with a correlation of just -18 percent, would be given no consideration at all.
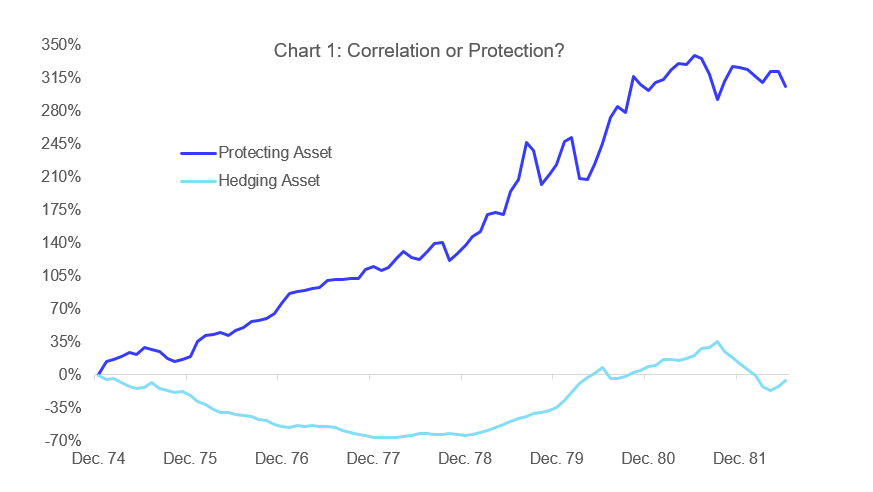
Investors living in the real world of inflation “protecting,” though, would come to just the opposite conclusion: sure, the hedging asset is perfectly correlated with monthly inflation, but its total returns averaged -0.7 percent per year and fell short of inflation by a stunning -8.5 percent per year. In fact, a dollar invested in the hedging asset at the end of 1974 would have been worth just 51 cents at the end of the period—that is, if you had invested in this “perfect hedge,” your wealth would have lost nearly half of its purchasing power after just 7½ years!
In contrast, the protecting asset provided total returns that averaged +20.3 percent per year and beat inflation by 10.8 percentage points per year, meaning that your purchasing power would have more than doubled even during the terrible inflation of the late 1970s and early 1980s. Not only that, but the protecting asset would have exposed you to less volatility, too: just 15.2 percent annualized compared to 17.8 percent for the hedging asset. (A purely visual analysis of volatility is misleading, in this case and in many others.)
The “hedging asset” represented by the light blue line is hypothetical (thank goodness), but the protecting asset represented by the dark blue line is real: equity REITs traded on stock exchanges really did outpace inflation by more than 10 percentage points per year during some of the worst inflation this country has ever seen.
For a broader view, Chart 2 summarizes my analysis of the long-term inflation-protecting performance of REITs and several other assets. This is essentially a “batting average”: I look at every rolling six-month period, determine whether inflation was relatively high or relatively low during that period, and ask how frequently the total returns for each asset at least covered the inflation rate during high-inflation periods—that is, how dependably each asset protected against a decline in purchasing power when purchasing power was most at risk. As you can see, REITs and commodities were practically identical in providing inflation protection, with each of them providing positive real returns during nearly 70 percent of high-inflation six-month periods. Stocks were pretty good too, and Treasury inflation-protected securities (TIPS) were better than fifty-fifty, while gold fell miserably short.
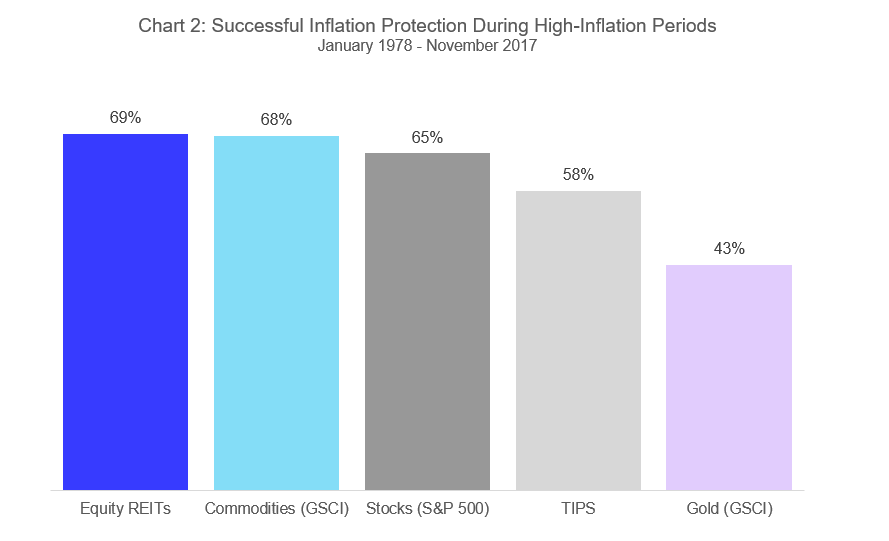
There are two important caveats to this analysis: (1) the historical data go back only as far as the beginning of 1978 because that’s the earliest date for which I have data on the returns to gold (for TIPS prior to December 1997 I use the back-filled returns computed by Ibbotson Associates), and (2) I use the S&P GSCI as my measure of commodity returns because it has a longer history than other commodity indices. Starting at the beginning of 1972 and excluding gold doesn’t change the conclusions in any important way, but using a different measure of commodity returns (such as the Dow Jones UBS) does change the conclusions because the S&P GSCI puts a larger weight on energy commodities, which have generally provided more dependable inflation protection than non-energy commodities.
An important risk that many investors forget about is this: you’ll have to predict high-inflation periods before you invest in assets that provide inflation-protecting returns. Chart 3 reveals the main problem with using commodity investments to protect against inflation: commodity returns have generally beat inflation handily when inflation turned out to be high—but commodities were the worst asset to be invested in when inflation turned out to be low. In other words, investing in commodities exposes investors to extreme prediction risk: if you rely on commodities to protect against inflation, you may end up having jumped out of the frying pan of high inflation right into the fire of negative returns.
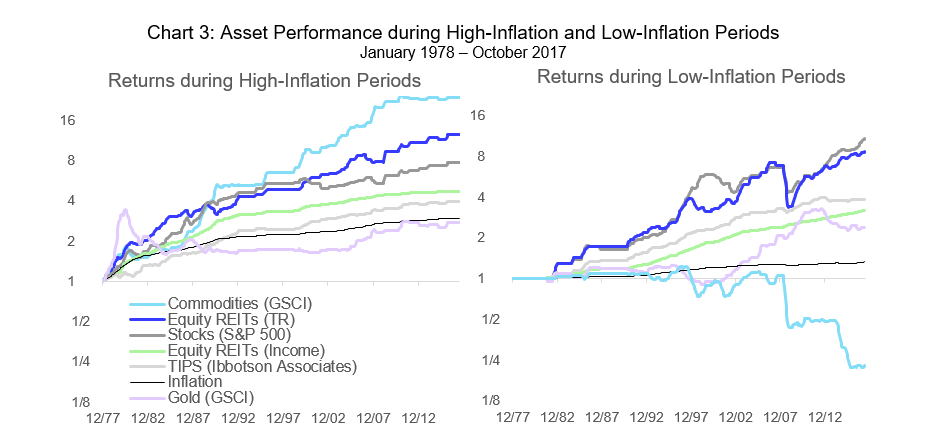
In contrast, REITs provided total returns that, on average, were second only to commodities when inflation was high and second only to the broad stock market when inflation was low. Moreover, the income from REIT investments (green lines) easily exceeded inflation, on average, during both high-inflation and low-inflation periods—whereas many commodity investments provide no income at all—and the income from REITs also exceeded the total return from TIPS during high-inflation periods.
To protect against both inflation risk and prediction risk, then, REIT investments have been much more successful than commodity investments. Does that mean you shouldn’t invest in commodities? Absolutely not: investors have access to a basket of assets with different inflation-protecting return attributes, and in such cases investors can usually do better by selecting an optimally diversified portfolio drawn from among all the available assets.
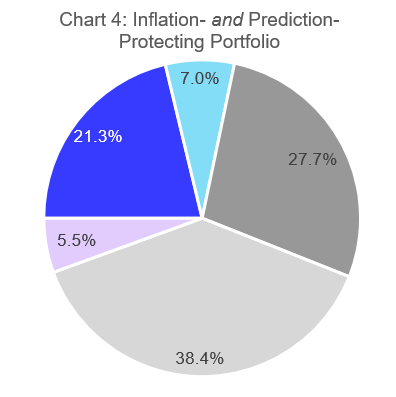 Chart 4 shows the diversified inflation-protecting portfolio that my analysis suggests. To form this portfolio I performed Markowitz mean-variance optimizations (MVOs) using the historical returns of each asset, first using just high-inflation periods and then using just low-inflation periods, and then minimized prediction risk by choosing the portfolio that maximized risk-adjusted returns in the less-favored state. The “inflation- and prediction-protecting portfolio” has its largest share in TIPS (38.4 percent) followed by stocks (27.7 percent) and REITs (21.3 percent), with much smaller allocations to commodities (7.0 percent) and gold (5.5 percent). During periods when inflation was relatively high, investments matching that allocation historically earned total returns averaging 6.31 percent per year with 12.3 percent annualized volatility for a Sharpe ratio of 0.476, the highest achievable during those high-inflation months. (The risk-adjusted returns of the same portfolio were slightly better during low-inflation periods with a Sharpe ratio of 0.590 based on total returns averaging 9.50 percent per year with 13.8 percent annualized volatility.) Moreover, the portfolio described by Chart 4 provided even more dependable inflation protection than any of the individual assets shown in Chart 2, with total returns covering the inflation rate during 70 percent of high-inflation six-month periods.
Will inflation become a problem again, as an increasing number of investors and market commentators fear? I don’t know—and that, of course, is just the point. If I knew what was going to happen in the future, I wouldn’t need “the magic of diversification” to protect me: I would be fine with just one single asset. Because I can’t know the future, I look for a diversified portfolio to protect me from inflation and a host of other risks. For me, that diversified portfolio has stocks, bonds, a little bit of commodities, a little bit of cash, and a very sizable allocation to REITs.
If you have any comments or questions please drop me a note at bcase@nareit.com.