Commercial property performance and valuation metrics diverge from time to time. Since 2000, there have been eight instances where public real estate materially underperformed its private market counterpart on a four-quarter total return basis. These REIT relative performance troughs have also been marked by significant valuation differences with REIT implied cap rates well exceeding private appraisal cap rates. Historically, these dislocations have presented opportunities for investors.
In the quarters after these troughs, public-private cap rate spreads have tended to compress, or close, and REITs have tended to outperform private real estate. Furthermore, larger cap rate spread reductions have typically been associated with greater levels of REIT outperformance. Although progress has been made, the current cap rate spread remains wide. This gap presents opportunity for property investors and suggests that there still may be more fuel in the tank for REIT outperformance in 2024.
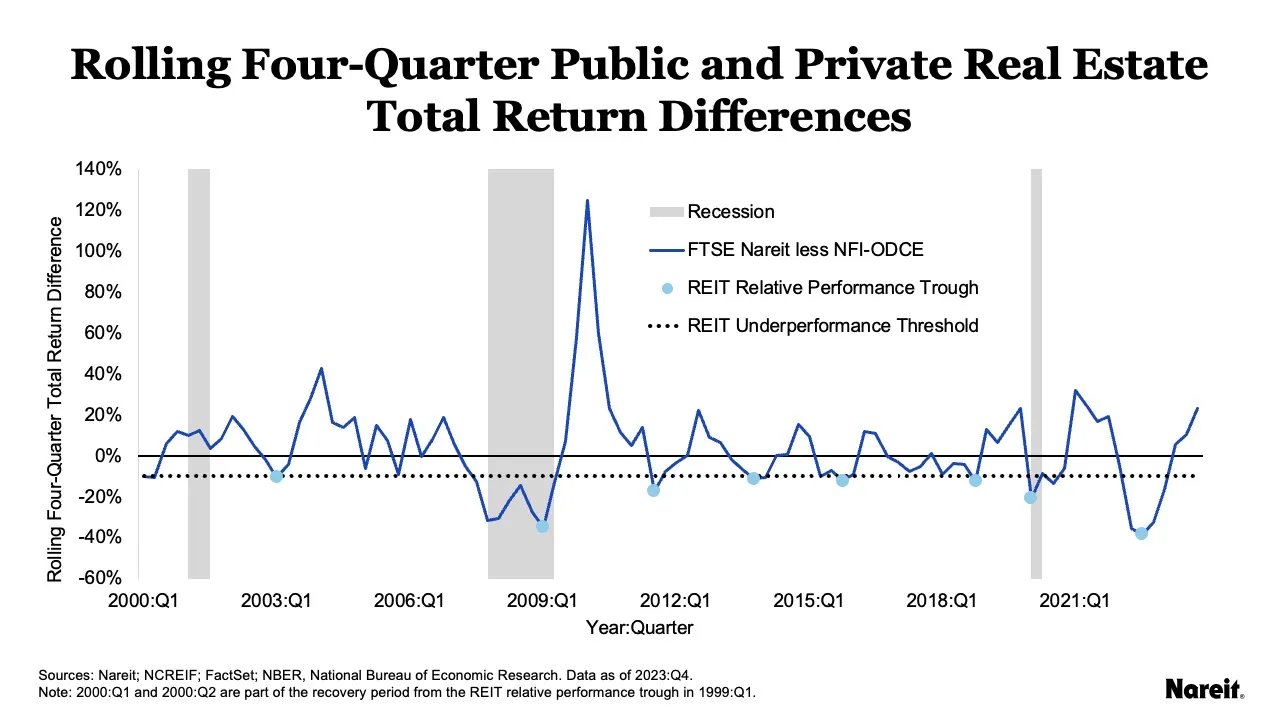
The chart above once again revisits the public and private property market divergences from the first quarter of 2000 to the fourth quarter of 2023. It displays rolling four-quarter total return differences between public and private real estate, REIT relative performance troughs, and U.S. recessions. Total return differences were calculated using FTSE Nareit All Equity Index (FTSE Nareit) and National Council of Real Estate Investment Fiduciaries Fund Index–Open End Diversified Core Equity (NFI–ODCE) data. Negative values highlight periods of REIT underperformance relative to private real estate; positive values indicate periods of REIT outperformance.
Of the eight periods of significant REIT underperformance relative to private real estate since 2000, only two coincided with U.S. recessions. Each of these REIT relative performance troughs had a nadir that was more negative than an established threshold of -10%. The most recent trough in the third quarter of 2022 had a total return difference of -38.4%. This marked the most significant degree of REIT relative underperformance in the last 45 years.
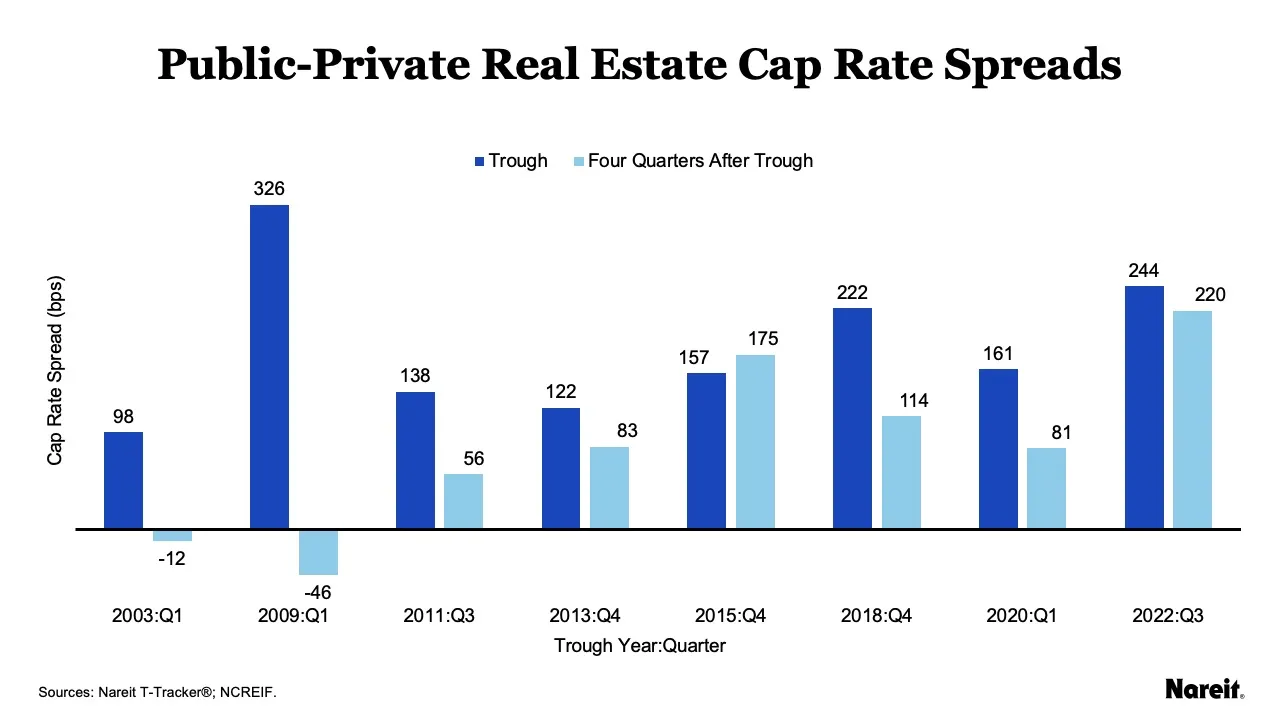
The chart above presents public-private real estate cap rate spreads at the time of and four quarters after each REIT relative performance trough since 2000. Spreads were calculated by subtracting NFI–ODCE property appraisal cap rates from Nareit Total REIT Industry Tracker Series, or T-Tracker®, REIT implied cap rates.
Across the eight troughs, the largest public-private cap rate spread occurred during the Global Financial Crisis (2009:Q1); it was 326 basis points. The current trough (2022:Q3) had the next largest gap at 244 basis points. The cap rate spread closed, and even reversed, over the course of four quarters in two instances (2003:Q1 and 2009:Q1); it expanded on one occasion (2015:Q4). For the remaining five troughs, cap rates compressed to some degree over the course of the following year.
Interestingly, the cap rate spread from the most recent trough (2022:Q3) has exhibited some stubbornness to close; it declined a mere 24 basis points, or roughly 10% of its starting value, over four quarters. This may be attributable, at least in part, to the limited number of third-party appraisal firms providing property valuation services to NFI–ODCE funds. A featured article in the Winter 2024 issue of PREA Quarterly indicated that Altus Group provides appraisal services to 23 of the 25 current NFI–ODCE constituents, and SitusAMC provides services for two funds. In November 2023, Altus Group entered into an agreement to purchase SitusAMC’s commercial real estate valuation business.
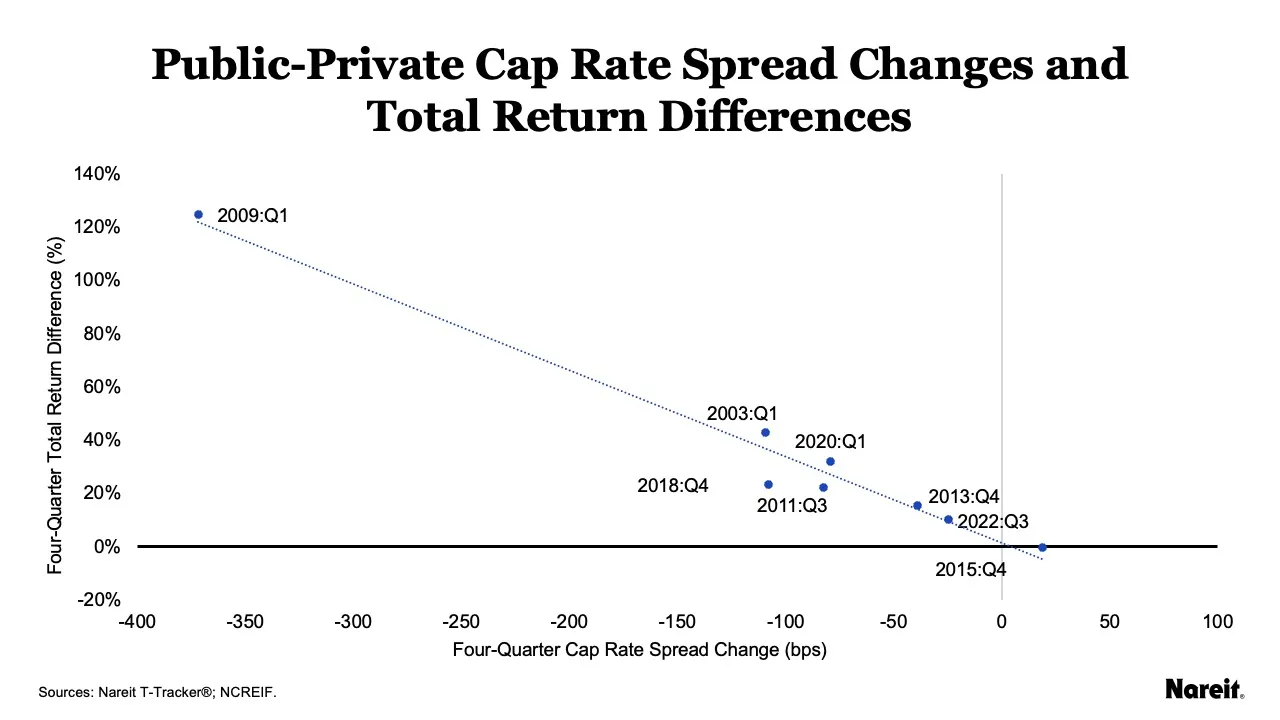
The chart above plots the four-quarter cap rate spread change and four-quarter FTSE Nareit less NFI–ODCE total return difference for each REIT relative performance trough. Positive total return difference values indicate periods of REIT outperformance relative to private real estate; negative values highlight periods of REIT underperformance.
The largest decline in the cap rate spread occurred in the four quarters after 2009:Q1; it was 372 basis points. This reduction was associated with REIT outperformance of 124.7%. In the year after 2015:Q4, the cap rate spread increased by 19 basis points and REITs underperformed by 0.1%. Further review of the chart shows that, historically, larger cap rate spread reductions have tended to be associated with greater levels of REIT outperformance in the four quarters after a REIT relative performance trough.
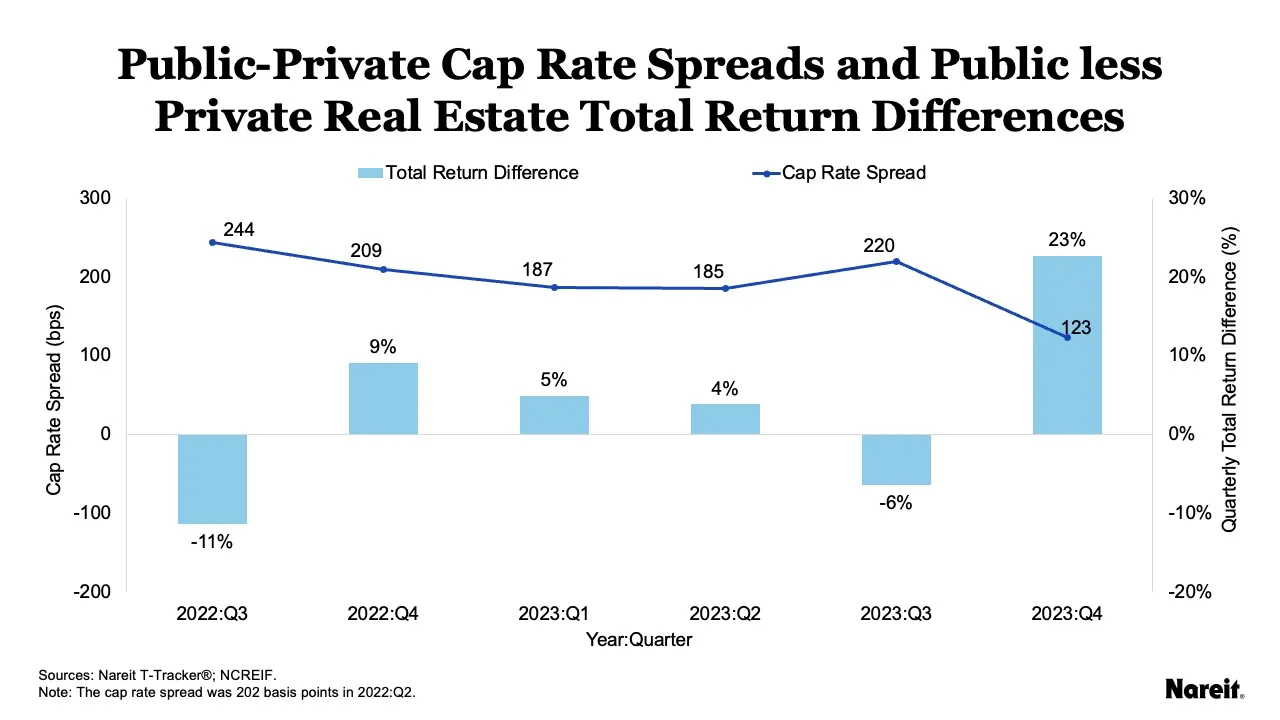
Although the current valuation adjustment process has been stubbornly slow, it has recently made progress. The chart above shows public-private cap rate spreads, as well as FTSE Nareit less NFI–ODCE total return differences, on a quarterly basis since the most recent REIT relative performance trough (2022:Q3).
Not surprisingly, during quarters when the cap rate spread declined (2022:Q4, 2023:Q1, 2023:Q2, and 2023:Q4), REITs outperformed private real estate; when the spread increased (2022:Q3 and 2023:Q3), REITs underperformed. In the last quarter of 2023, the cap rate spread plunged to 123 basis points and public real estate performance surged. REITs posted a total return of 17.9%, outperforming private real estate by 22.7%. While past performance may not be indicative of future results, the wide year-end cap rate gap presents an opportunity for real estate investors and suggests that there still may be more fuel in the tank for REIT outperformance in 2024.