Stock exchange-listed Equity REITs have historically provided not merely strong long-term total returns and steady current income, but also several forms of diversification:
- Most important, REITs provide asset class diversification because the real estate market cycle is quite different from, and much longer than, the business cycle that drives earnings and stock prices for companies in the rest of the stock market.
- Every exchange-listed REIT provides granularity, which reduces risk by distributing that risk across a large number of separate assets—so, for example, a REIT investor’s wealth cannot be destroyed by a fire or other natural disaster that could wipe out the owner of a single property.
- Almost every exchange-listed REIT provides geographic diversification because it owns properties across a large region or multiple parts of the country, thereby protecting investors from the effects of a local or regional downturn.
- Finally, while most exchange-listed REITs hold portfolios that are concentrated in a particular property type, investors can gain property type diversification by owning shares in REITs from the different property-type sectors (and subsectors) of the industry.
All of these forms of diversification can reduce the volatility of an investment portfolio without reducing its returns. To diversify each portfolio optimally—that is, to maximize returns within the bounds of each investor’s tolerance for changes in portfolio balance—it helps to have a good sense of how different sectors of the REIT market interact with each other as well as with the broad stock market.
Demonstrating the benefits of REIT-based real estate investment in terms of asset class diversification, over the past 20 years the correlations between the broad exchange-traded Equity REIT industry and the broad stock market has usually been between 44.2% and 66.4%, with a median of 54.5%. (I use monthly total returns from the FTSE NAREIT All Equity REITs Index and the Russell 3000 Stock Index, along with a DCC-GARCH empirical methodology, which provides estimates of the correlation during each month over the 20-year period.) Because different property types move differently from each other, however—as well as differently from the rest of the stock market—returns for a diversified portfolio of REITs in a given sector may be even less similar to the broad stock market than the REIT industry is as a whole.
Table 1 shows the 25th percentile, the median, the 75th percentile, and the latest estimate of correlations for each REIT sector with the Russell 3000 during the 20-year period from April 1996 through March 2016. (I include only those sectors and subsectors for which we have returns data back to the beginning of 1994; the early months are used to initialize the model.) The inter-quartile range may be interpreted as the “normal” range of correlations because it represents half of the available months: the REIT-stock correlation was greater than the upper end of the range (the 75th percentile) one-fourth of the time, and less than the lower end of the range (the 25th percentile) one-fourth of the time.
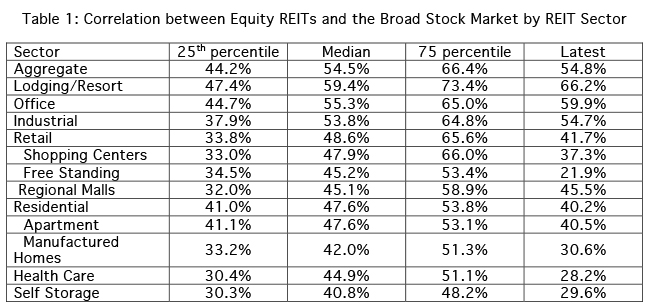
Self storage REITs generally displayed the lowest correlations with the broad stock market, with a median of just 40.8% and an inter-quartile range (IQR) of 30.3% to 48.2%. Health care REITs also displayed exceptionally low correlations with the broad stock market, with a median of 44.9% and an IQR of 30.4% to 51.1%. Those two sectors were hardly alone, however, in countering monthly movements in the non-REIT part of the stock market: every sector has displayed a median REIT-stock correlation of less than 60%, and every sector has shown correlations of 48% or less during more than one-fourth of the last 20 years.
Subsectors, too, have tended to display low correlations with the broad stock market. Within the Residential sector, the Manufactured Homes subsector has shown a median correlation of just 42.0% and an inter-quartile range of just 33.2% to 51.3%. Similarly, within the Retail sector we’ve seen median correlations of 47.9% for Shopping Centers, 45.2% for Free Standing and 45.1% for Regional Malls, with inter-quartile ranges of 33.0% to 66.0%, 34.5% to 53.4%, and 32.0% to 58.9%, respectively.
Turning to property type diversification, the different sectors of the REIT market differ sharply from each other even though they’re all part of the real estate asset class. Table 2 shows the average value of the median correlation for each sector or subsector with all of the other sectors or subsectors of the REIT industry over the same 20-year historical period. (I’ve left out the Residential and Retail sectors because they are represented by their respective subsectors.)
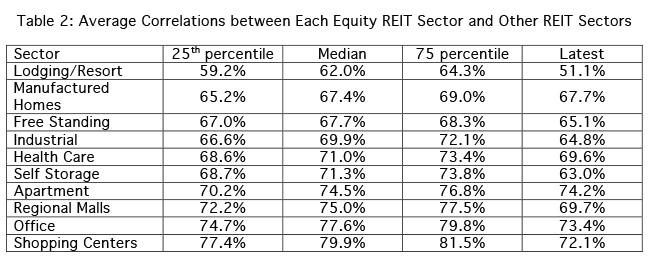
Lodging REITs have generally displayed the lowest correlations with the rest of the Equity REIT industry: The average value of the median correlation between the Lodging & Resort sector and the other sectors and subsectors shown has been just 62.0%, with the average correlation usually within the range of 59.2% to 64.3%. Shopping Center REITs have typically been most similar to other segments of the equity REIT industry, but even there the average value of the median correlation has been just 79.9% with an inter-quartile range of 77.4% to 81.5%, indicating that even the “most typical” REITs have provided strong diversification benefits relative to the rest of the REIT industry.
The last piece of data—besides, of course, expected total returns!—useful in helping to construct the optimal REIT allocation to take advantage of both asset class diversification and property type diversification is relative volatilities. Here it’s important to keep in mind that diversification of any sort helps to bring down volatility and more companies generally helps produce more diversification: For example, the Russell 3000 Index should generally be expected to display less volatility than the FTSE NAREIT All Equity REIT Index simply because it includes between 16 and 27 times as many companies over the period analyzed. Similarly, the FTSE NAREIT All Equity REIT Index should generally be expected to display less volatility than any of the REIT sector or subsector indices, simply because the aggregate index includes more companies and is diversified across all property types whereas each sector or subsector index is restricted to the REITs in that property type. The benefits of diversification come from combining companies from the different market segments to take advantage of the low correlations across them.
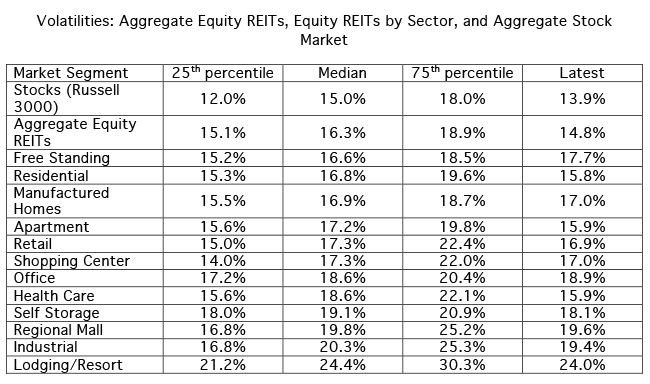
As Table 3 shows, the median volatility of REIT sector and subsector indices has been remarkably similar to the median volatility of the broad stock market, considering how narrowly focused each sector/subsector index is. Free standing retail REITs, for example, displayed a median volatility of just 16.6% over the available historical period, hardly greater than the 16.3% for the equity REIT industry as a whole; in fact, the inter-quartile range of volatilities for the Free Standing Retail subsector was even narrower than for the entire equity REIT industry, at 15.2% to 18.5% compared with 15.1% to 18.9%. Of course, combining all sectors/subsectors (including those not shown here because they have shorter available histories), in proportion to their market capitalizations, is equivalent to investing in the aggregate equity REIT industry, which has typically been only slightly more volatile than the broad stock market.
Remember that the correlations and volatilities that I’ve summarized aren’t enough for any investor to make well-informed decisions regarding how much of their portfolio to invest in real estate stocks and how to allocate their real estate portion among the different sectors and subsectors of the equity REIT industry. For that purpose, you may need to meet with your financial advisor to discuss your long-term goals, risk tolerances and expectations regarding future returns from the real estate market cycle compared to the business cycle. These historical numbers, though, may help you have greater confidence in making your real estate investment decisions.