Homeownership is stabilizing, but weak job market is still holding back both rental and ownership markets.
The home ownership rate held steady for the final three quarters of 2013 at 65.1 percent, after having declined a half-percentage point or more each year since its peak in the mid-2000s (Chart 1). This tentative stabilization suggests that housing markets may soon move beyond the mortgage crisis and back to a period of more normal recovery and growth.
Yet data on household formation show that the recovery is still being held back by the weak job market. Household formation, when one or more people move out of shared accommodations to buy or rent a place of their own, is the ultimate source of demand for both home ownership and rental apartments.
Household formation often falls in recessions but usually rebounds in economic recoveries. The current recovery, however, still shows no sign of rebound, as the rate of household formation over the past year has been stuck at 0.25 percent, well below the long term trend of 1.25 percent (Chart 2). Millions of unemployed or under-employed people are doubled-up with roommates or family members, and are waiting until the job market improves before they rent their own place.
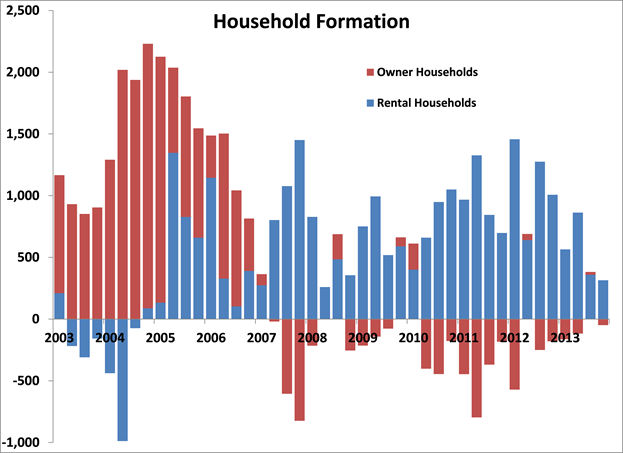
The limited number of new households that did form in 2013 moved into rental properties, as weak incomes, lack of money for a down payment and tight lending standards make it difficult for many of them to get a mortgage (Chart 3).
The anemic pace of household formation suggests that demand for housing (both rental and purchase) will remain subdued in the first half of 2014. If job growth accelerates, however, the pent-up demand of 3 million to 4 million “shadow households” could turn into an actual demand for purchase or rental. The additional demand for rentals from these “shadow households” will keep the demand for apartments tight even as the home sale market gets back to firing on all cylinders.
Chart 1
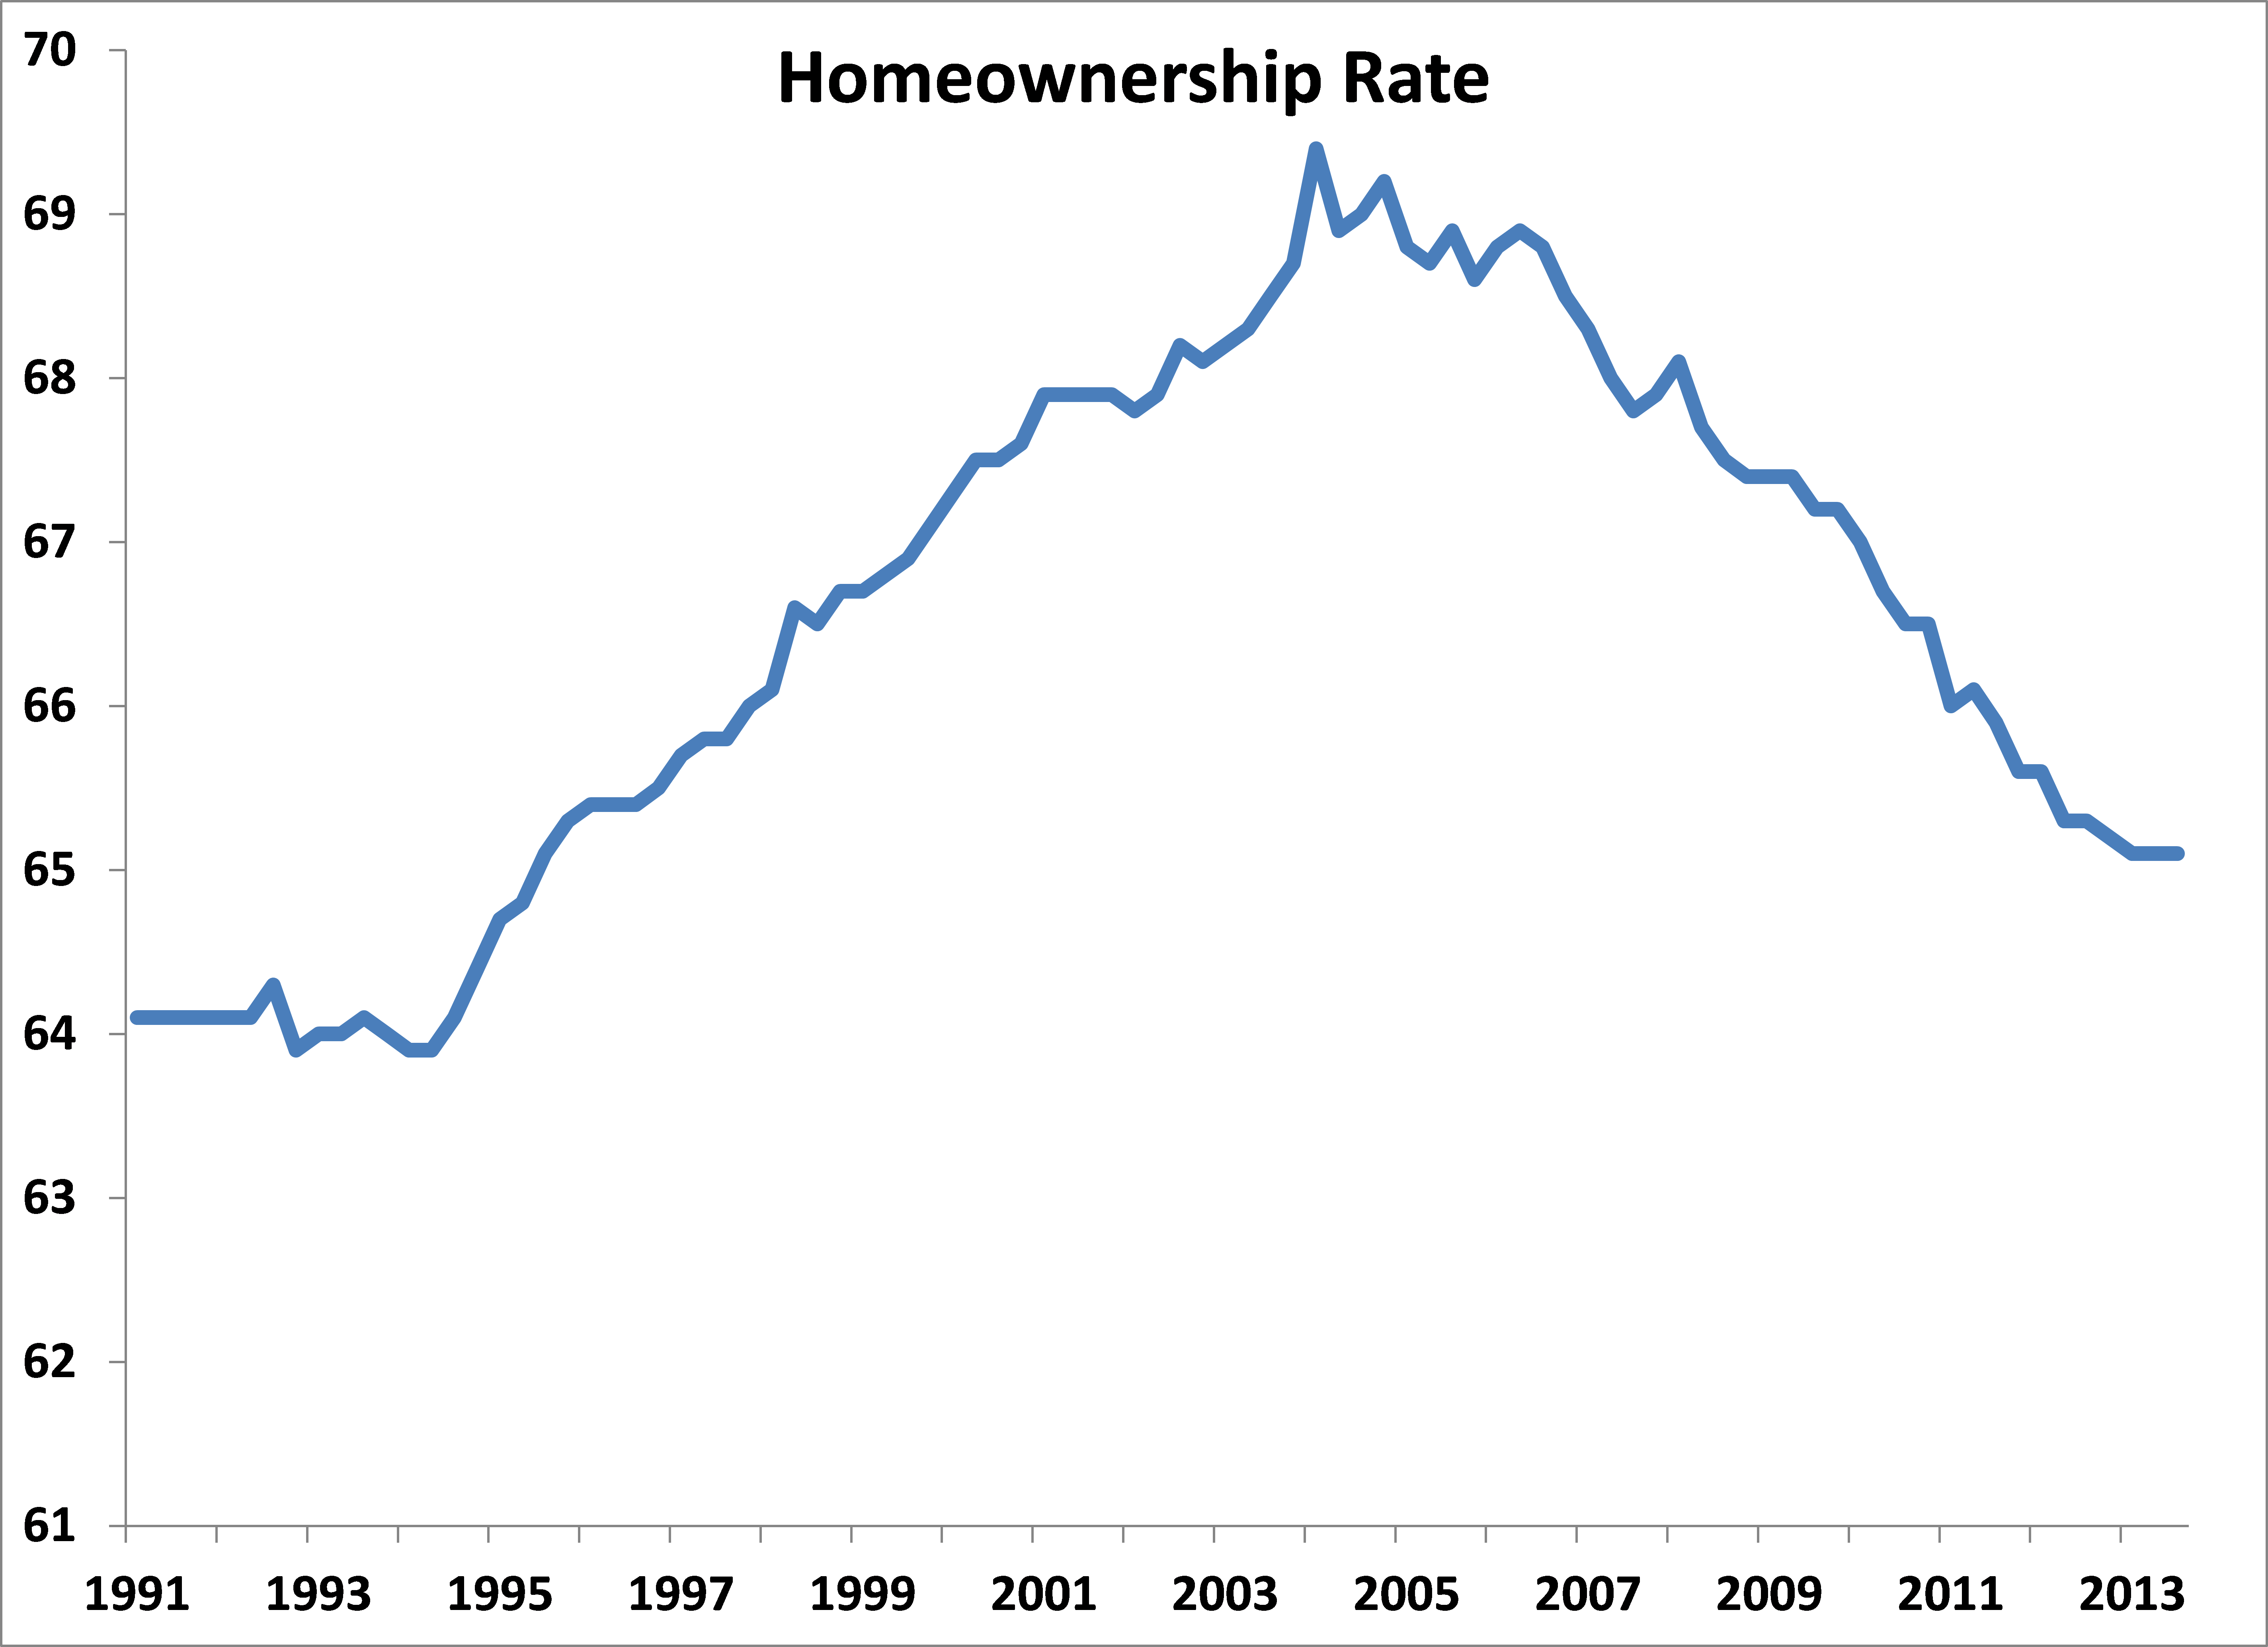
Chart 2
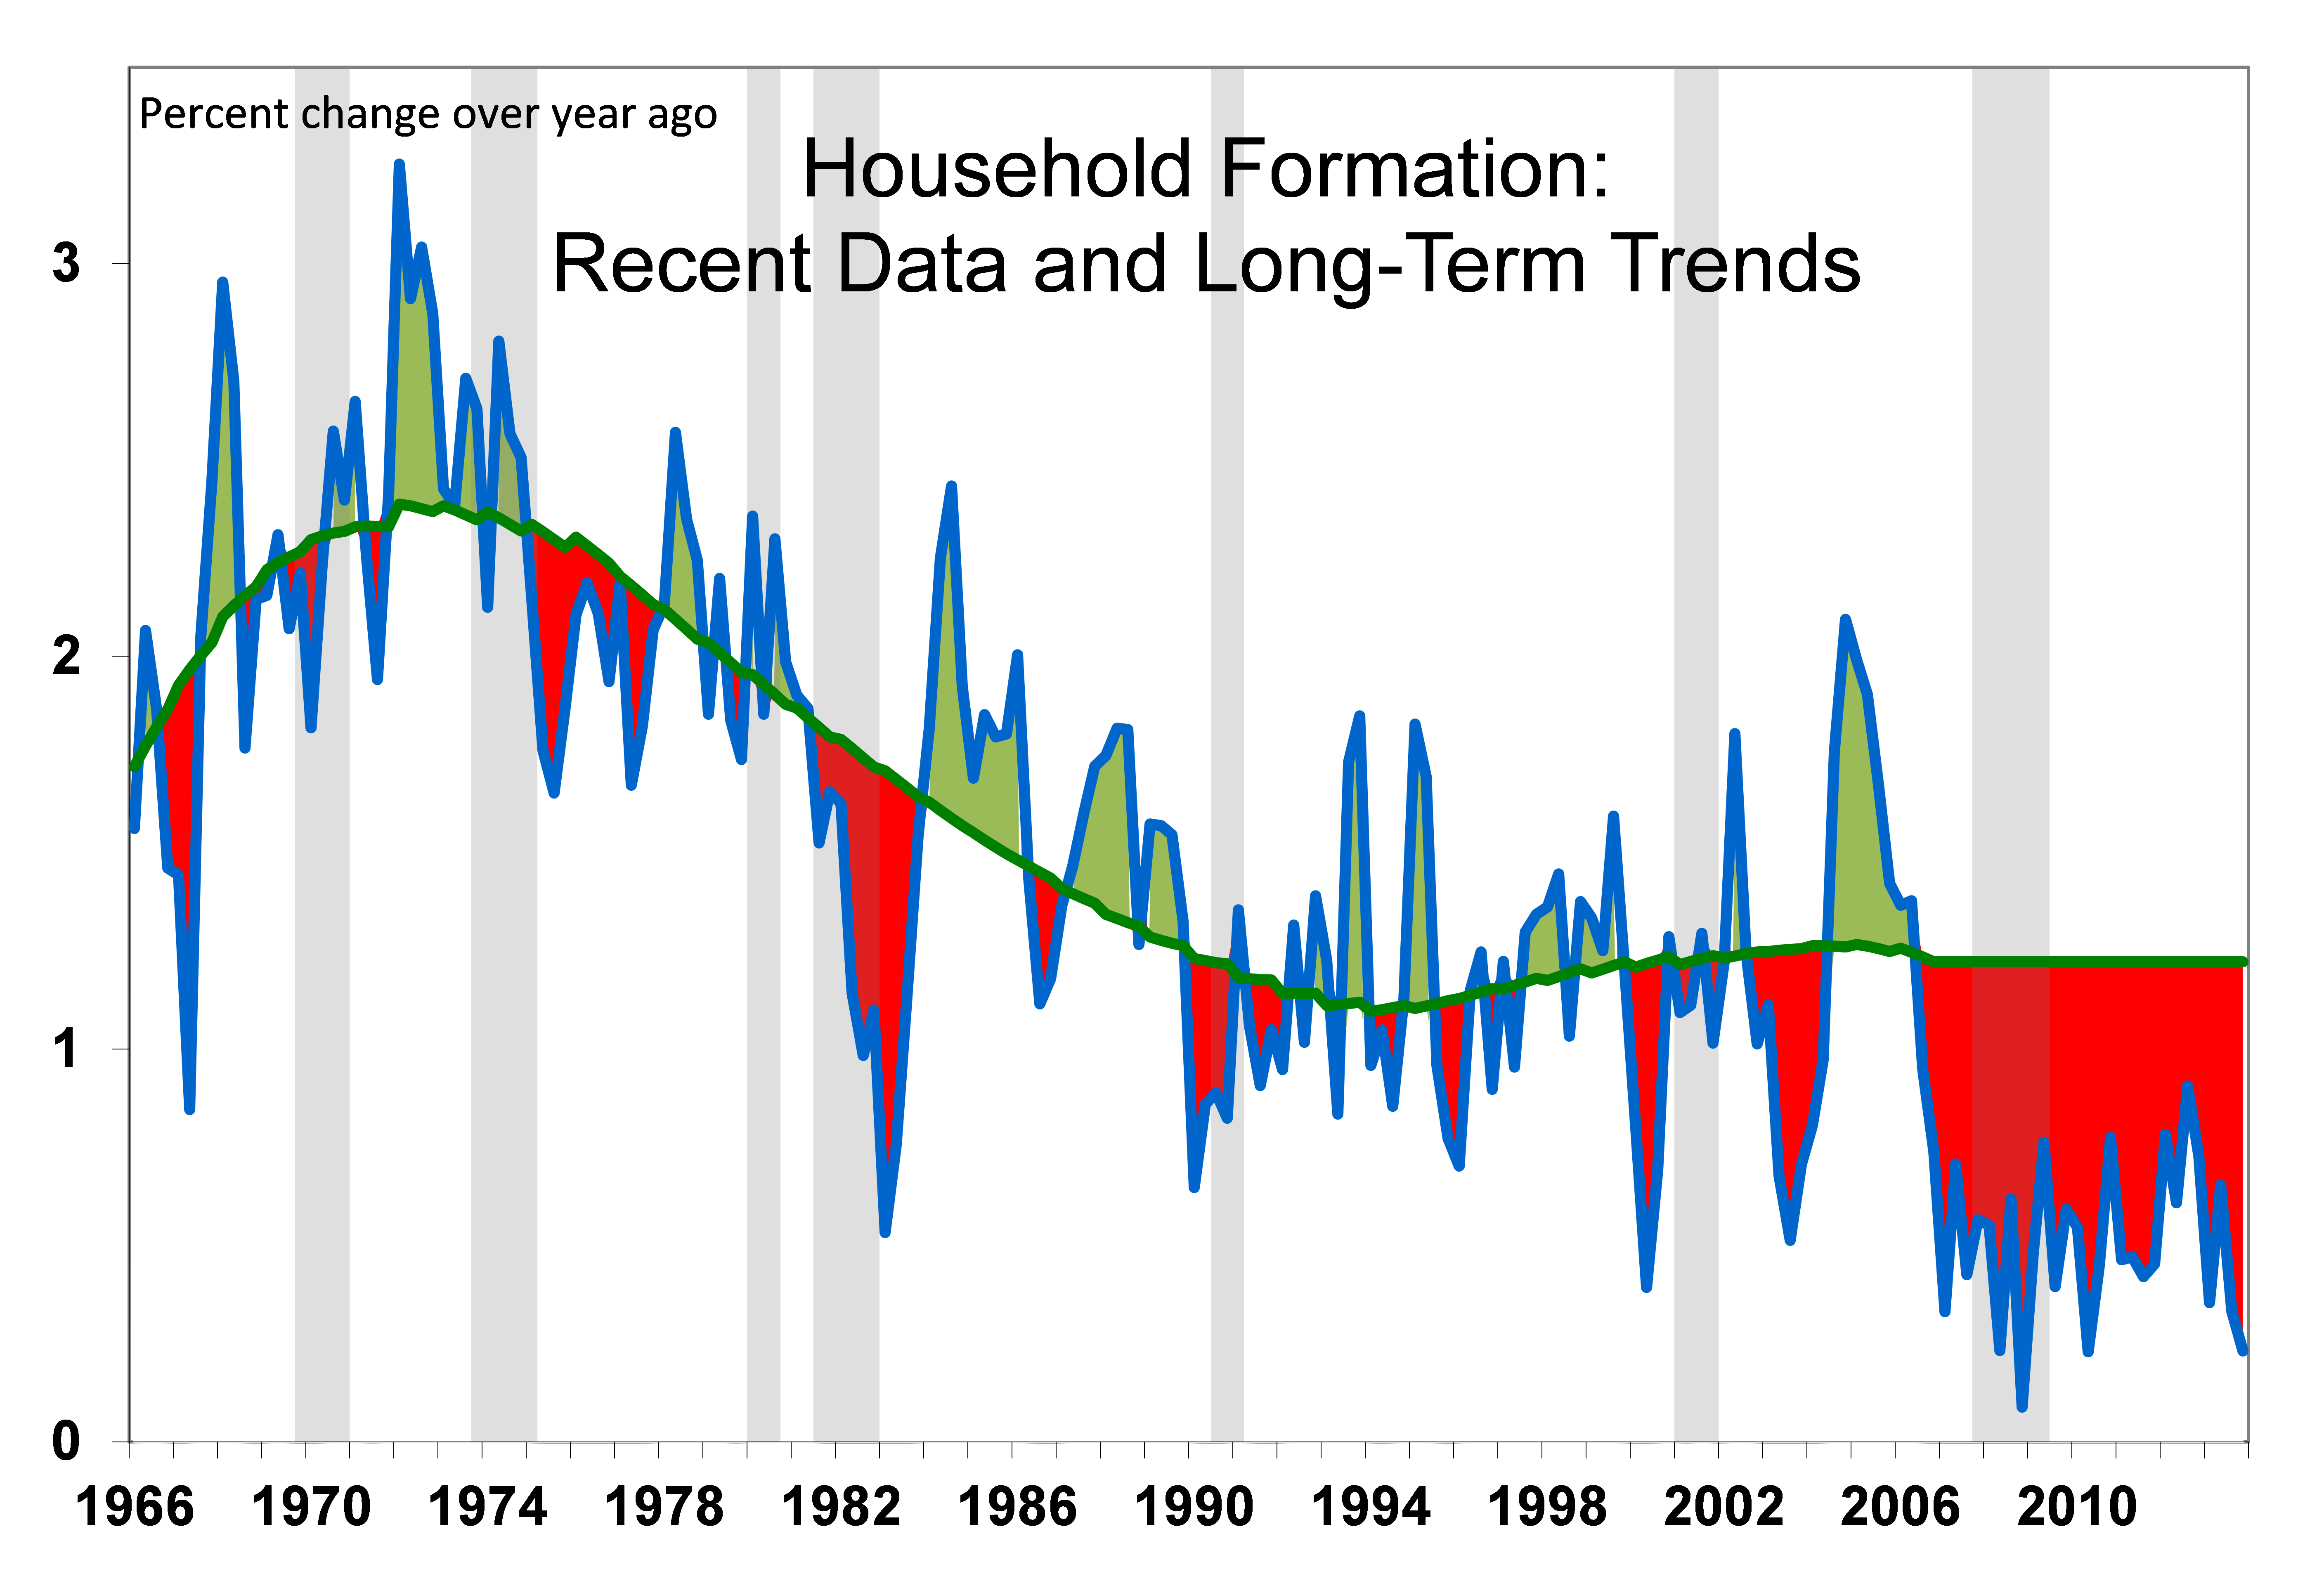
The current rate of household formation is shown in blue line; long-term trend shown in green line; “shadow demand” is the red area between the two. Shading shows economic recessions.
Chart 3