The pandemic left a deep mark on commercial real estate in the fourth quarter as falling demand for leased space led to a rise in vacancy rates across most property types, and rents declined. Sales of commercial properties rebounded, however, after a near halt in activity during the spring and summer, and transactions-based priced indices were stable, suggesting that market participants believe the pandemic’s impact will fade as vaccine distribution proceeds and the overall economy continues to recover.
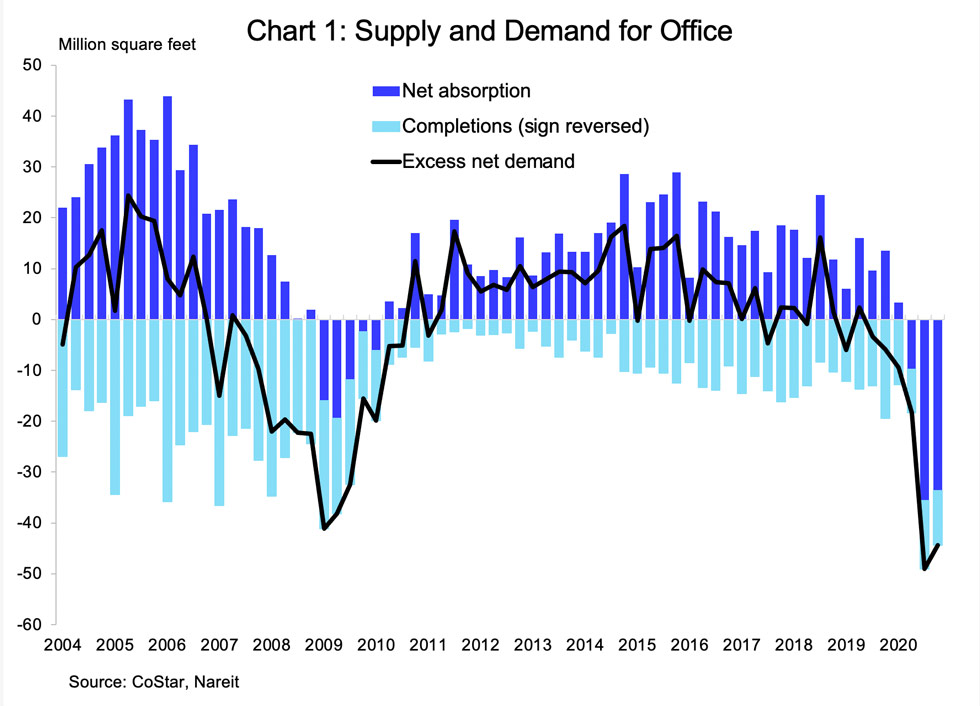
Demand for office space fell most sharply as work-from-home (WFH) and a drop in office-based employment during the pandemic has curbed firms’ need for office space. Net absorption was negative (i.e. occupied space declined) at -33.6 million square feet, following a 35.6 million decline in occupied space in the third quarter. New supply has moderated to 10.8 million square feet (light blue bars, sign reversed) from a high of 19.4 million square feet in 2019:Q4.
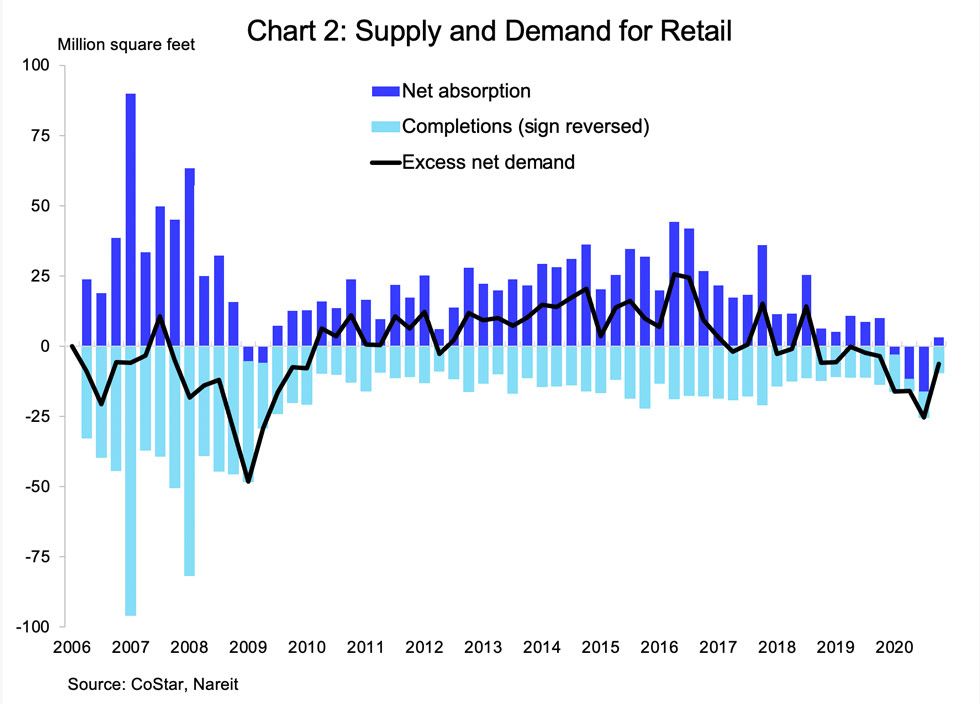
Demand for retail space was weak but slightly positive in the fourth quarter, with net absorption of 3.1 million square feet. Completions of retail space exceeded net absorption slightly.
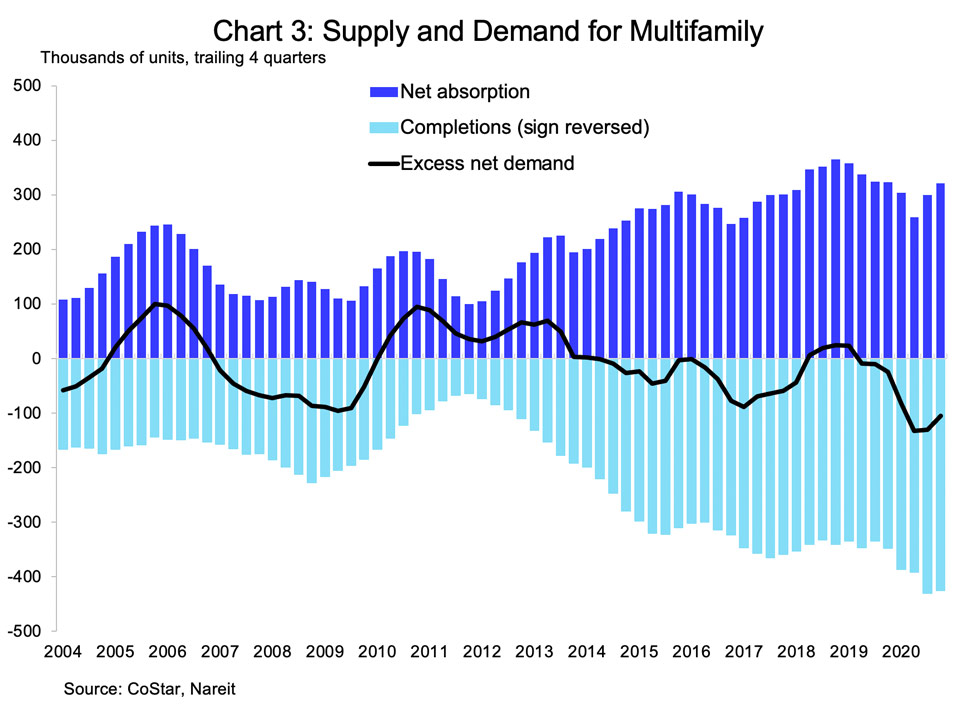
Demand for multifamily units has been less than new supply over the past four quarters (chart 3 displays trailing four quarters due to the strong seasonal patterns in apartment leasing).
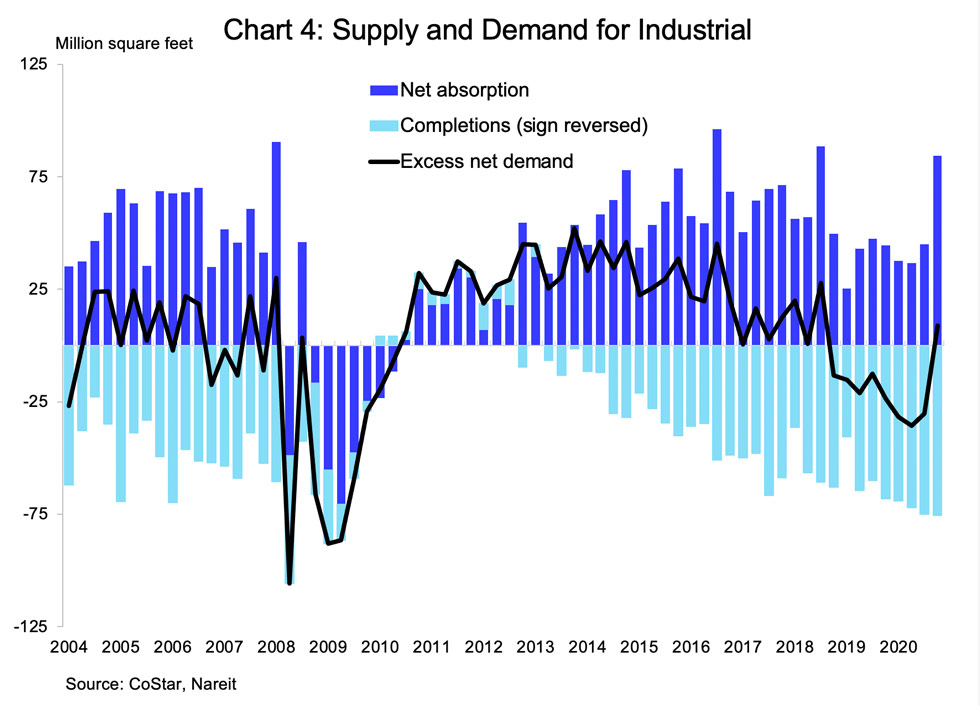
Demand for industrial space, in contrast, jumped to 84.4 million square feet, more than double the average quarterly pace during the first three quarters of the year. The increase in net absorption resulted in positive excess demand (i.e. net absorption minus completions) for the first time since the third quarter of 2018.
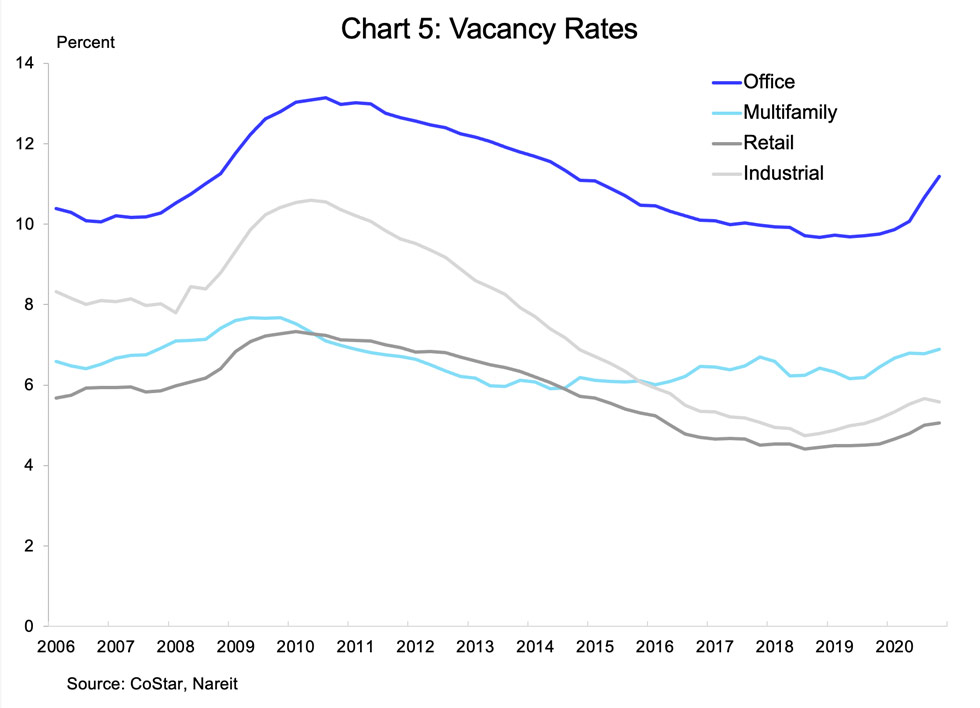
Vacancy rates rose for office, multifamily, and retail property markets. Vacancy rates in the office market rose 50 bps in the fourth quarter after a 60 bp increase in the third quarter, and are 145 bps above one year ago. Multifamily and retail markets had smaller increases in vacancy rates, of 10 bps and 5 bps, respectively. Vacancy rates for industrial space, in contrast, declined in the fourth quarter, dropping 10 bps to 5.6%.
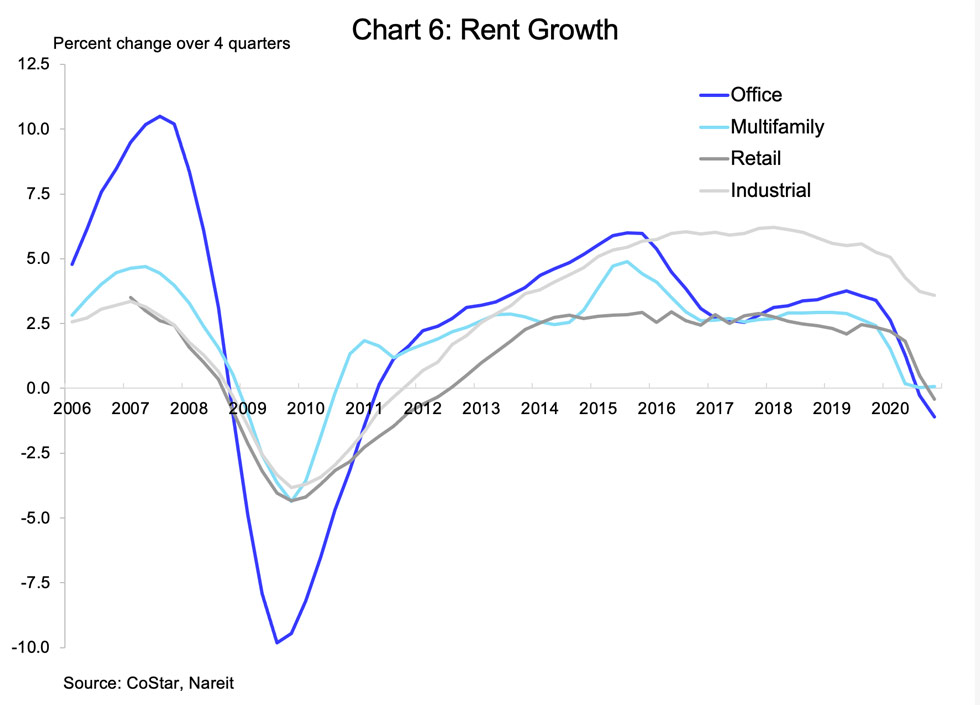
Rents declined in the three markets with rising vacancy rates. Office rents were 1.1% lower in the fourth quarter than one year earlier, and multifamily and retail rents were 0.3% and 0.4% lower, respectively. Industrial rent growth has decelerated to 3.6% over one year ago, from a 6% pace as recently as 2018.
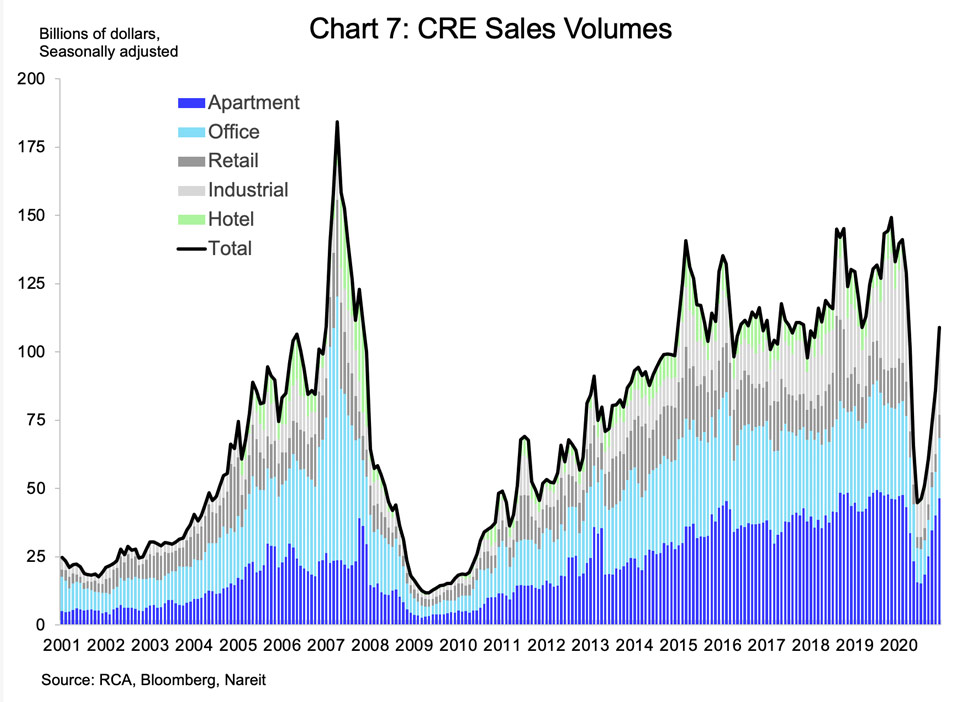
Transactions volumes of commercial properties rebounded in the fourth quarter, after having plunged during the early months of the pandemic. Sales of industrial and multifamily properties recovered fully by the end of the year to be back to year-ago levels. Sales of office and retail properties had partially recovered, to 35% and 45%, respectively, below year-ago. Transactions in hotel properties, in contrast, were 75% below year earlier.
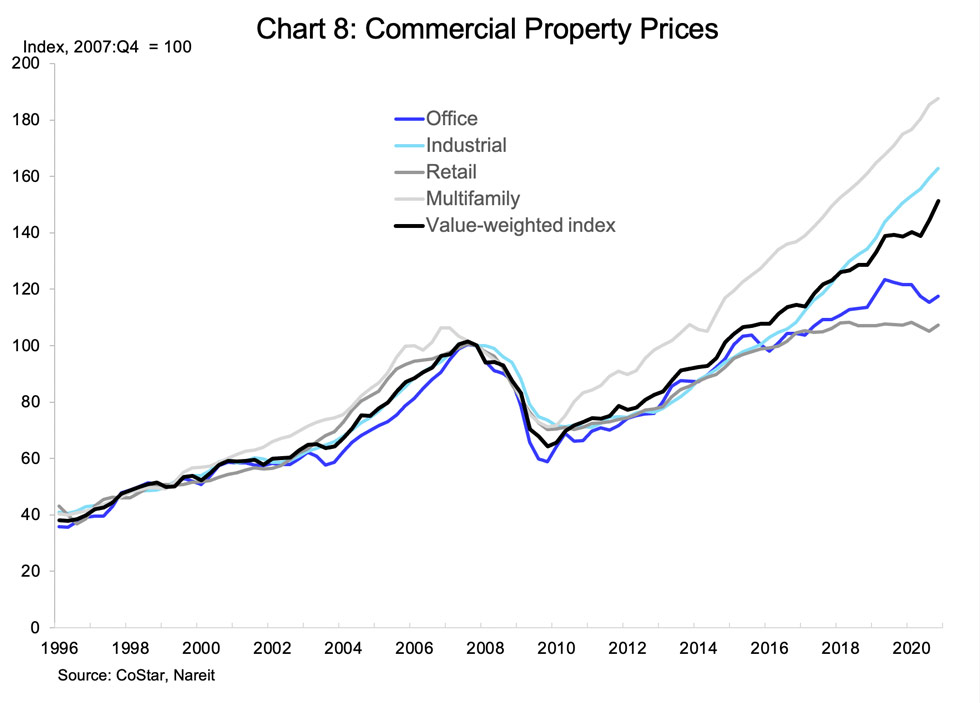
Commercial property prices were surprisingly resilient, considering the declines in demand and rents in 2020. Prices of office properties were weakest, according to the CoStar Commercial Repeat Sales Index, but still were down only 3.4% compared to the fourth quarter of 2019; retail property prices were in line with year-ago. Prices of multifamily and industrial properties, in contrast, have continued rising through the pandemic, and were 7.2% and 8.0% higher, respectively, than one year ago.