GRESB, a Global ESG Benchmark for Real Assets, has released its 2022 data on environmental stewardship, social responsibility, and good governance for REITs. The GRESB Real Estate Assessment measures the sustainability performance of individual real estate portfolios based on self-reported data. U.S. publicly traded REITs have increased their participation in GRESB, growing from 35 REITs in 2015 to 69 in 2022. Participating REITs continue to see year-over-year improvements in their key performance indicators from 2015 to 2022.
The most recent data shows that REITs reduced energy consumption by 1.8% in 2021 over the prior year, reduced greenhouse gas emissions by 3.4%, and held water usage about flat. These performance improvements are particularly notable because they come after large reductions in all three measures in 2020 that were driven in part by reduced intensity of use during the pandemic. These measured reductions were not driven by any one property sector but reflect widespread reductions across many property sectors. Participating REITs across all sectors have increased their share of energy use from renewable sources to 9.0% in 2021, with data center participants sourcing nearly 50% of energy from renewables.
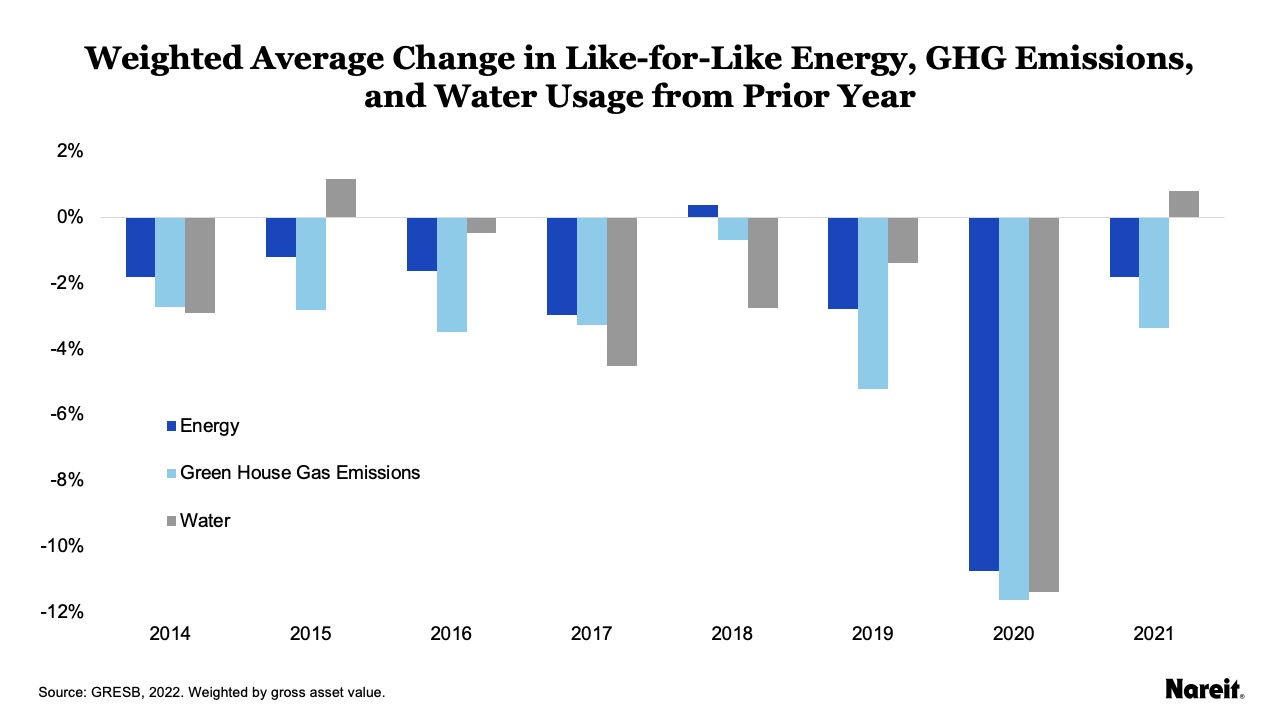
The chart above shows the percentage change in usage for all properties that were in a REIT’s portfolio in the prior and current years, or “same store” usage. Each REIT that submitted data to GRESB is weighted by gross asset value to construct a weighted average change across all REITs for the year. Annual data reflects the REITs that reported in that year.
REITs have made consistent year-over-year reductions in energy consumption, greenhouse gas emissions, and water usage from 2014 to 2021. Not surprisingly, 2020 saw large declines in all three as the pandemic reduced usage of many property types. Energy consumption was down an average of 10.7% in 2020 from 2019, greenhouse gas emissions were down 11.6%, and water usage was down 11.4%. However, despite the economic recovery in 2021 that saw people returning to their pre-pandemic activities, REITs not only maintained these gains, but actually achieved further reductions in energy (-1.8%) and greenhouse gas emissions (-3.4%), while water usage remained flat from the prior year (0.8%).
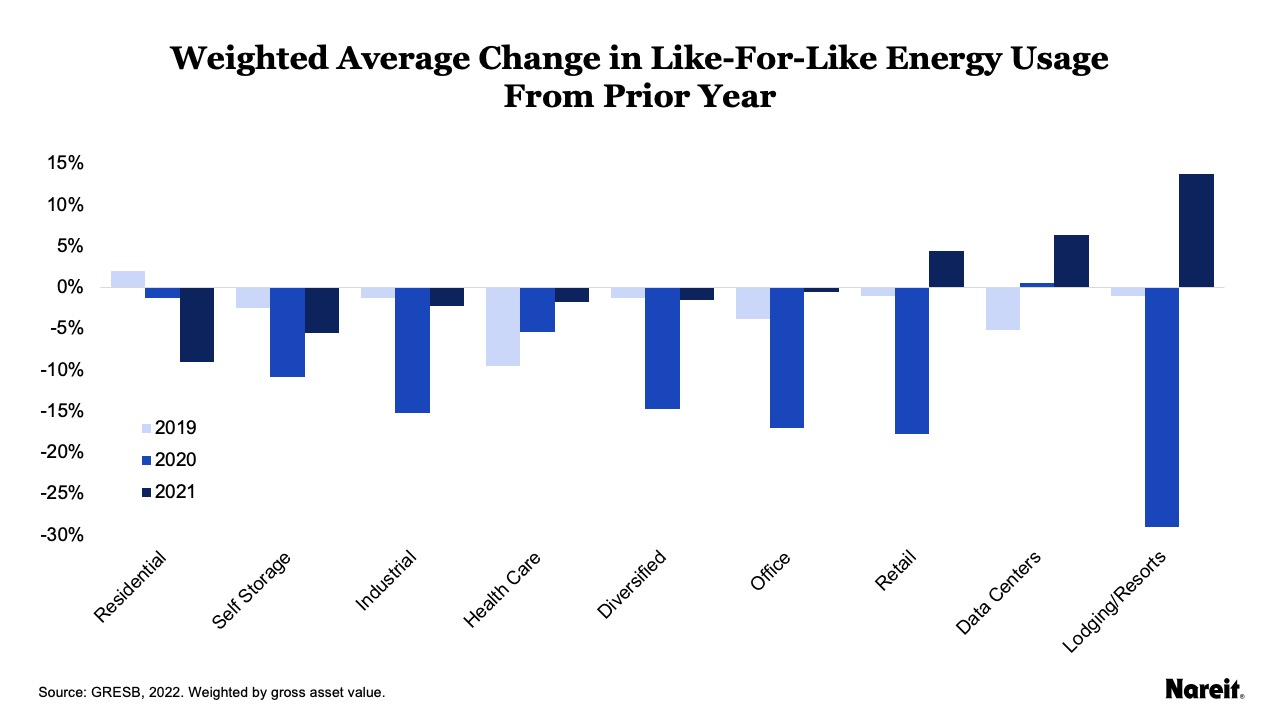
Drilling down into these changes by property sector, the chart above shows reduction in energy usage across property sectors for 2019 to 2021. In 2019, most property sectors saw modest reductions in energy usage from the prior year with a slight increase for residential. For health care, reductions were largest in 2019; and for data centers, 2019 was the only year of the three that showed a reduction in energy usage.
The largest reductions came in 2020 for most property sectors. Lodging/resorts had the largest 2020 reduction, down 29% from 2019 levels, as travel restrictions were common across the country and internationally. Energy usage increased in the sector for 2021 as recovery began. Industrial, diversified, retail, office, and self-storage all had energy reductions over 10% in 2020. Most of the sectors held onto those reduction in 2021 with only retail, data centers, and lodging/resorts showing usage increases over the prior year as the economy reopened.
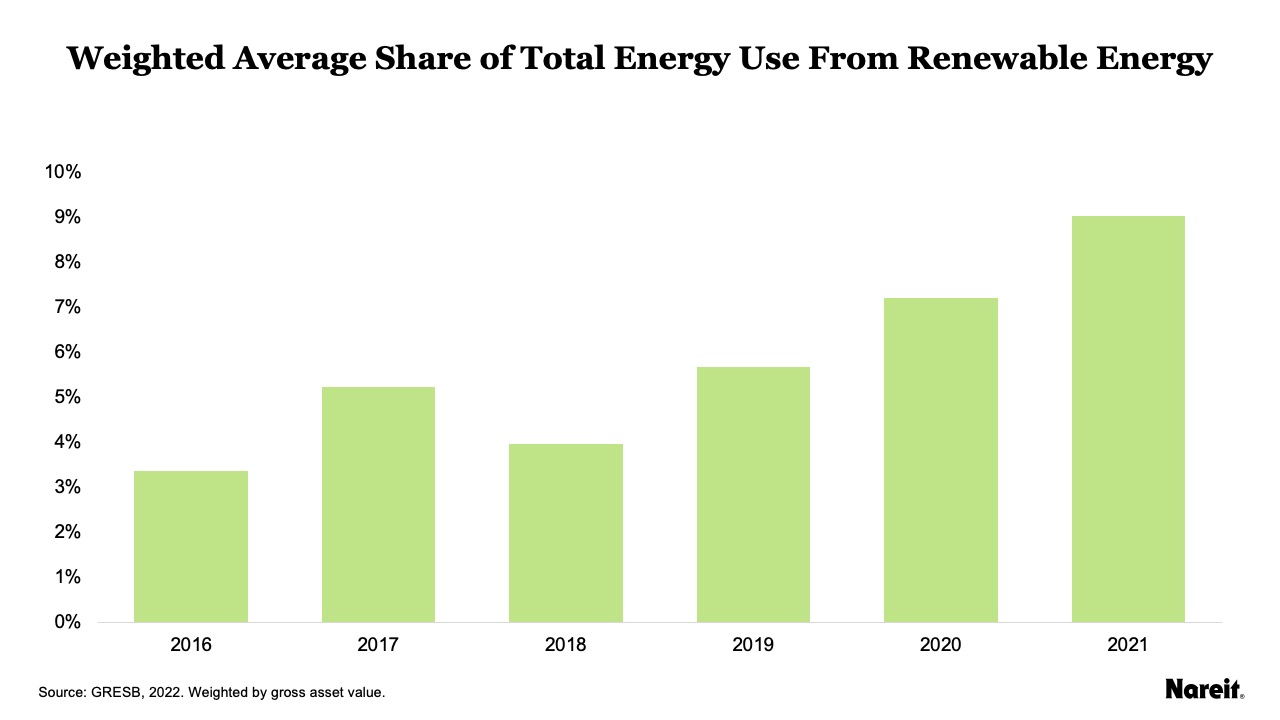
In addition to reducing overall energy consumption, REITs are also making strides in sourcing more of their energy from renewable sources. The chart above shows the share of renewable energy used across REITs, weighted by their gross asset value. The share of renewable energy grew from 3.4% in 2016 to 9.0% in 2021.
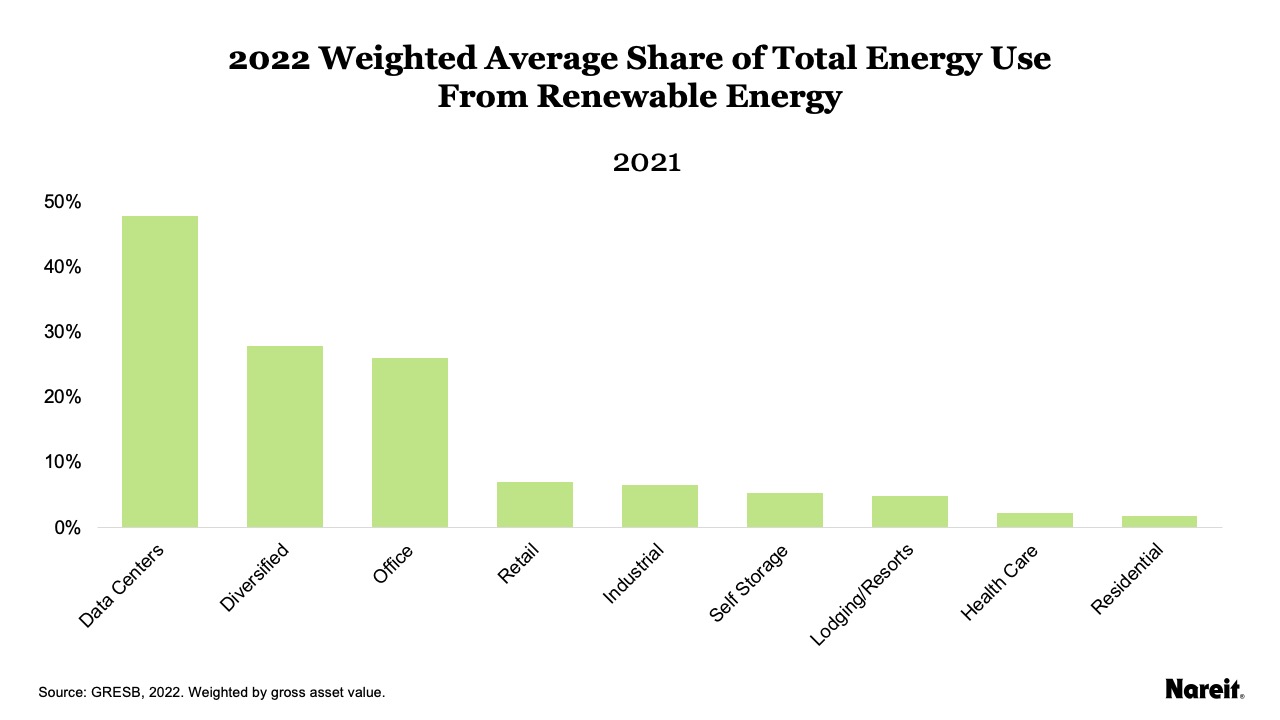
By property sector, data centers, diversified, and office REITs account for the bulk of the renewable energy use in 2021, as shown in the chart above. Participating data centers are approaching half of their energy sourced from renewables, at 48%. Diversified sourced 28% from renewable sources, and office sourced 26%. The remaining sectors were all under 10%.