I’m sure you’ve seen the headlines about market volatility, including “No Calm in Sight as Volatility Surges from Stocks to Bonds” (Bloomberg, 1/18/16), “What To Do with the Market’s Volatility” (Fox Business, 1/19/16), and “Why The Stock Market Is Volatile, Why Volatility Hurts, And What To Do About It” (Forbes, 1/16/16). Just how bad is it?
Look behind the headlines and you’ll find that volatility has really not been that bad, especially for REIT investors. The chart below shows how volatility has changed since the beginning of 2012 for the broad stock market (Russell 3000 Index, shown in grey) and for the exchange-traded equity REIT market (FTSE NAREIT All Equity REITs Index, shown in green). The dotted lines show the interquartile range over the entire available historical period since the beginning of 1999, meaning that volatility was greater than the upper dotted line one-fourth of the time, and less than the lower dotted line another one-fourth of the time. For REITs, annualized volatility based on daily returns has usually been between 11.6% and 21.9% with a median of 15.1%; broad stock market volatility has usually varied between 12.3% and 20.2% with a median of 15.7%.
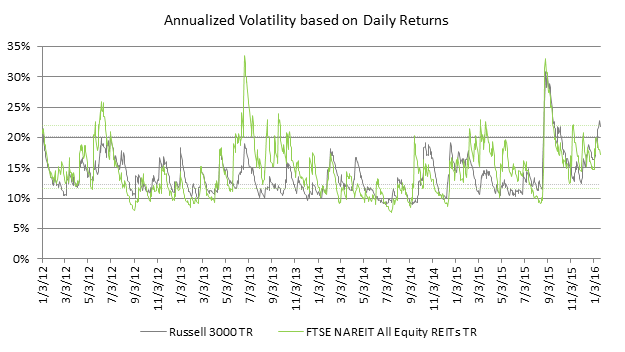
You can immediately see a couple of episodes when volatility spiked, including the “taper tantrum” of June-July 2013 as well as the broad sell-off of August-September 2015. Look more closely, however, and you’ll see that more recent volatility has actually been well within the range that the past 16 years defines as “normal,” at least until the stock market’s bumpy ride during January 13-15 of this year pushed its volatility to almost 23%. REIT volatility remained within its normal range, at least through January 20.
During the two months from late August through late October 2015, REIT volatility plummeted from a high of 33.0% all the way to 12.4%, and—except for brief turmoil on November 6 & 9—has remained within its inter-quartile range since the middle of September. High volatility in the broad stock market lasted a bit longer but showed a similar decline from its late-August high of 30.9% to 12.4% at the beginning of December; since then stock volatility has picked up, but only in the middle of January 2016 did it pop out of its interquartile range.
Investors seem to have gotten used to what turns out to have been extraordinarily low volatilities from about September 2013 to March 2015, and from that point of view what they’ve seen over the last three months may seem unsettling. Over long investment horizons, though, equity investors have been rewarded with higher returns as compensation for “normal” equity volatility—and what we’ve seen recently doesn’t give me any cause for concern.
Here are the technical notes: volatilities are computed using a dynamic conditional correlation model with generalized autoregressive conditional heteroscedasticity (DCC-GARCH, developed by Nobel prize-winning economist Robert Engle). DCC-GARCH is pretty much the state of the art for this sort of analysis because it’s both accurate and sensitive to the most recent market conditions. The model is estimated using daily data, but weekly data show a very similar pattern.