Multifamily markets rebounded in the first quarter with the second-highest quarterly demand growth on record, according to data recently released by CoStar, while the deterioration in office markets continued. Retail markets have stabilized somewhat, with small positive net absorption for the second quarter in a row after significant negative net absorption in the second and third quarters of 2020. Industrial markets enjoyed robust demand, with net absorption of 89 million square feet, the highest demand growth in three years.
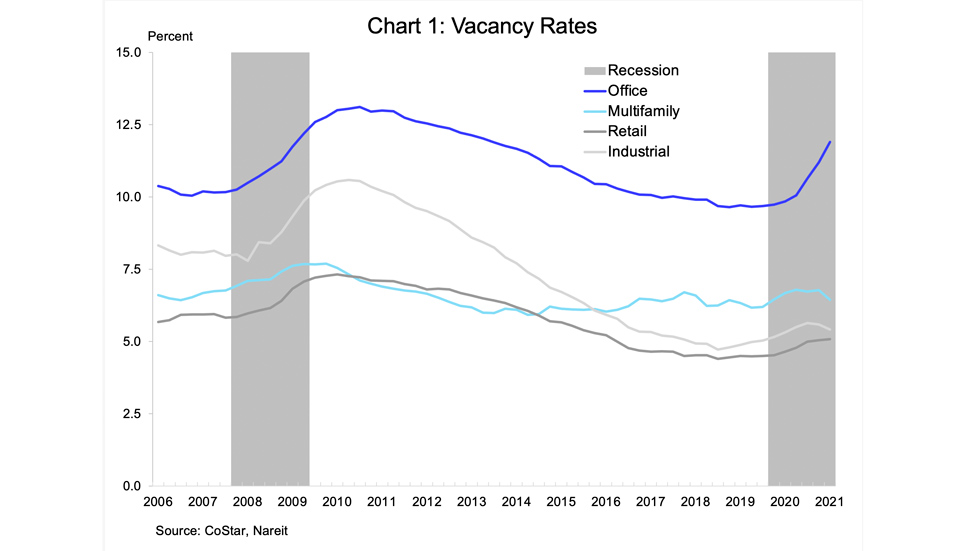
Vacancy rates reflected the different stages of recovery across property types. Office vacancy rates rose 70 bps, to 11.9%. Vacancy rates declined in multifamily and industrial markets, and were little changed in retail.
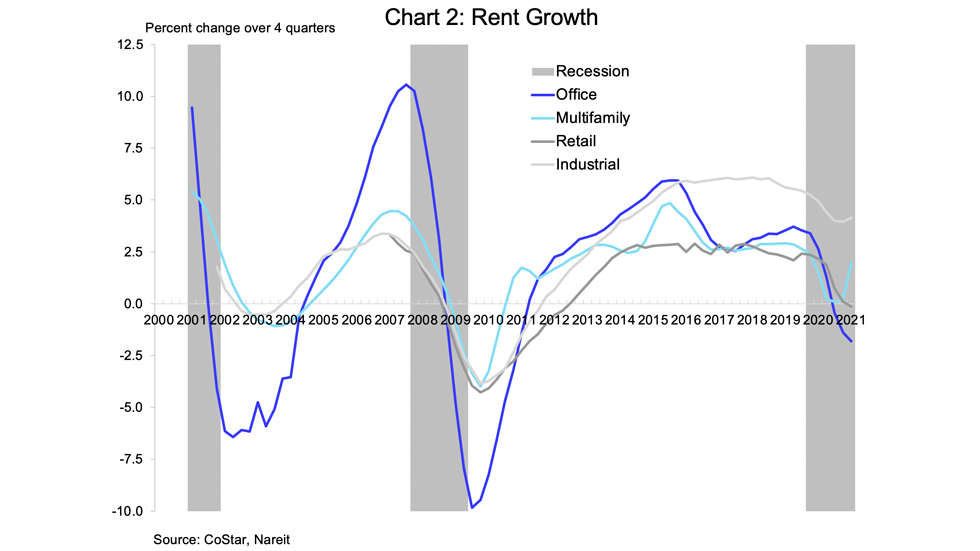
Rent growth also diverged across property types. Office rents continued to decline in the first quarter, although the 10 bp decline was significantly slower than the 40 bp and 100 bp declines in the second and third quarters of 2020. Nationally, office rents in the first quarter were 1.8% lower than one year earlier. Rent growth in multifamily markets in the first quarter was 1.6% over year ago. This positive growth is in contrast to the rent declines through the latter half of 2020. Growth of industrial rents accelerated to 4.1% over year ago, while retail rents were little changed.
For additional perspective and historical context, the final four slides below show details about supply and demand across the office, retail, multifamily and industrial markets:
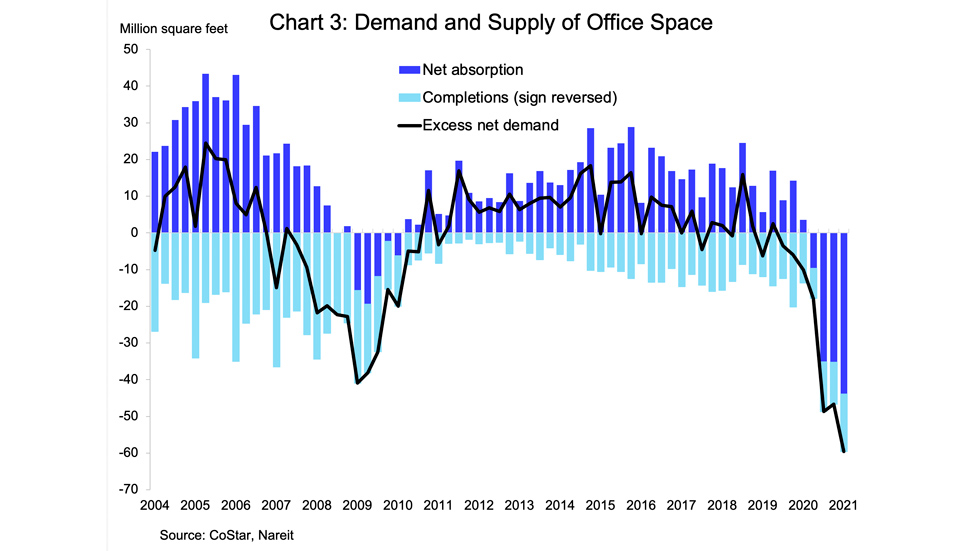
Office markets experienced an accelerating decline in net absorption, with leased space falling by 44 million square feet, compared to declines of 35 million square feet in both the third and fourth quarters of 2020 (chart above, dark blue bars). This is the largest quarterly decline in leased space on record, and compares to a cumulative decline of 55 million square feet over five quarters during the financial crisis of 2008-2010. New supply totaled 16 million square feet (light blue bars, with sign reversed), exacerbating the negative excess net demand (demand less supply, shown in the black line).
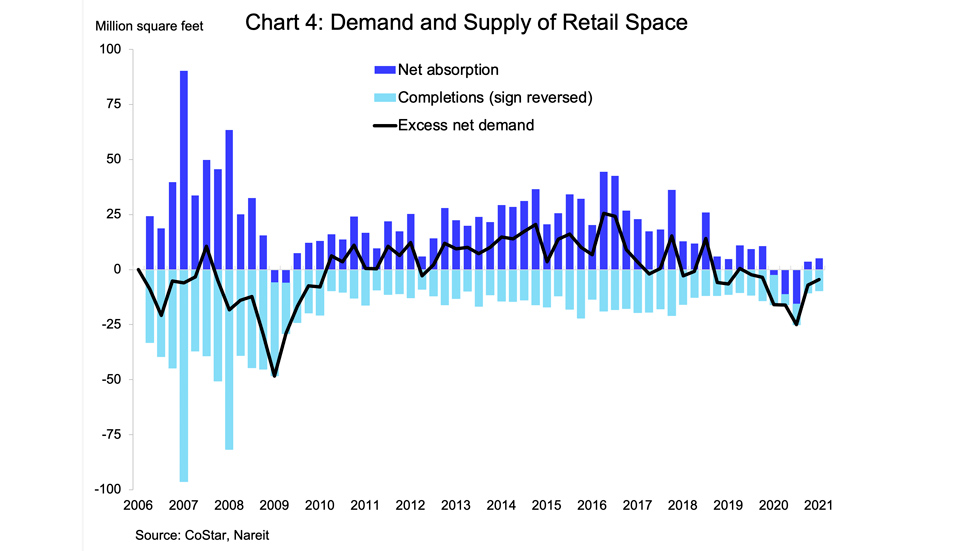
Retail property markets showed some signs of stabilizing, with net demand of 5 million square feet. Although net demand remains weak, it has turned positive over the past two quarters after having been negative from the onset of the pandemic in the first quarter of 2020 through the third quarter.
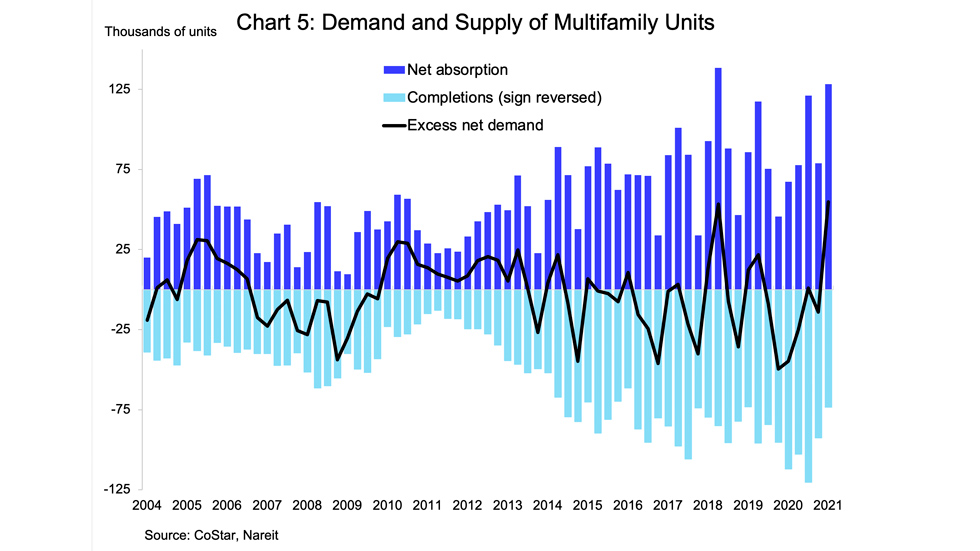
Multifamily markets had net absorption of 128 thousand units, the second highest on record. Demand typically strengthens in the spring leasing season, suggesting the market may firm further in the current quarter. Demand over the past four quarters was 406 thousand units, the highest on record.
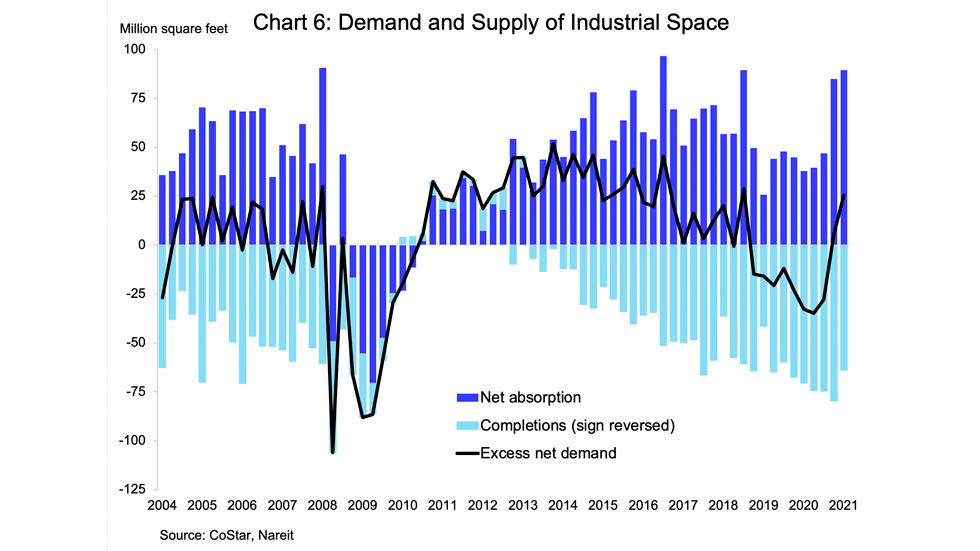
Industrial markets enjoyed a surge in demand with net absorption of 89 million square feet, highest in three years.