The new global active manager tracker follows the quarterly investment holdings of the largest actively managed funds invested globally. There are 25 large actively managed global real estate funds (22 reporting as of September 2025) with $16.7 billion in real estate assets under management as of the second quarter. These globally focused funds manage their investments in different geographies and property sectors. Separately, Nareit’s active manager tracker follows the largest actively managed funds focused on U.S. real estate.
There are significant differences between actively managed funds strategies and the FTSE EPRA Nareit Global Extended Index in geographic and sector allocations.
- The funds are overweight in the Americas region and underweight in the Asia Pacific region; the share in Asia Pacific has been declining in the last five years.
- The funds’ highest allocations are in residential and diversified, although allocations to those sectors have been falling over the last several quarters.
- Data centers, lodging/resorts, self-storage, and health care are all overweight compared to the index, while diversified and telecommunications have been persistently underweight.
- Active managers have increased their allocations in retail, data centers and health care in the last five years, while pulling back on office, diversified, and residential.
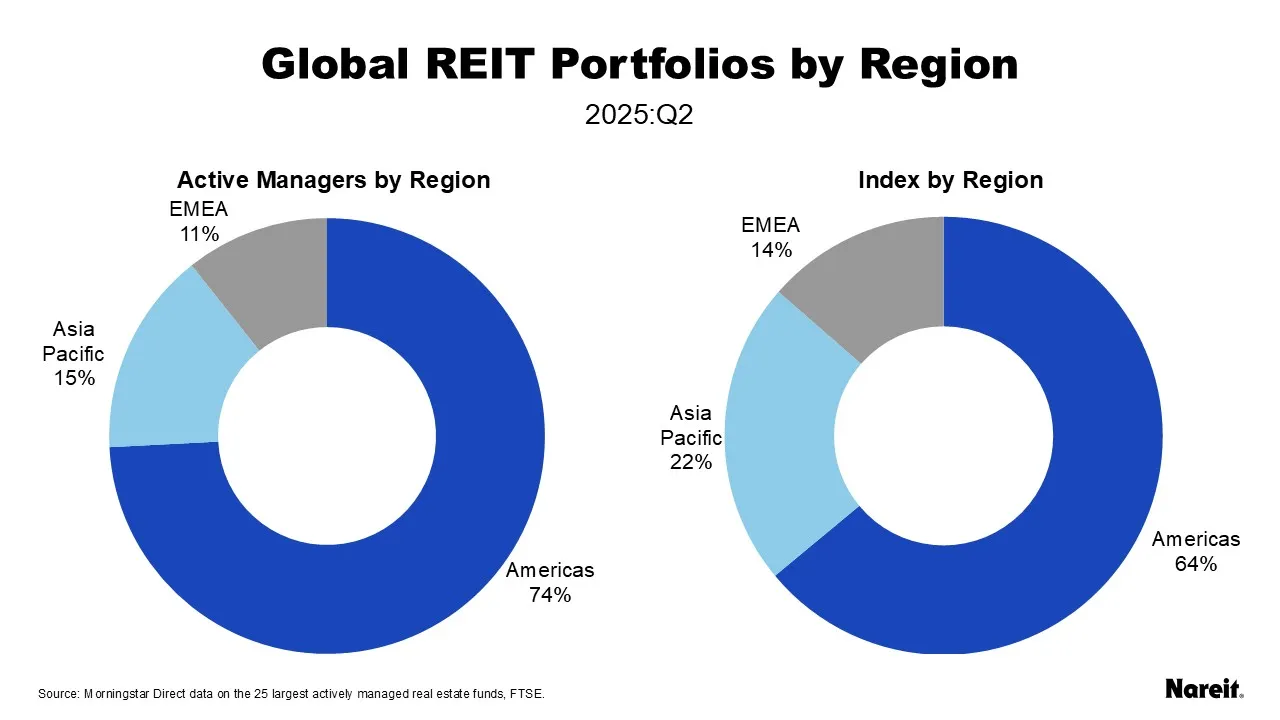
The geographic allocations for the actively managed funds are compared to the FTSE EPRA Nareit Global Extended Index in the chart above. Active managers are predominantly invested in the Americas, mostly the U.S., and have a higher allocation to the region; 74% compared to 64% for the index. In contrast, the index has a higher allocation to the Asia Pacific region at 22% than active managers at 15%. The smallest allocation for active managers is to the Europe, Middle East, and Africa region (EMEA) at 11% compared with a 14% weight for the index.
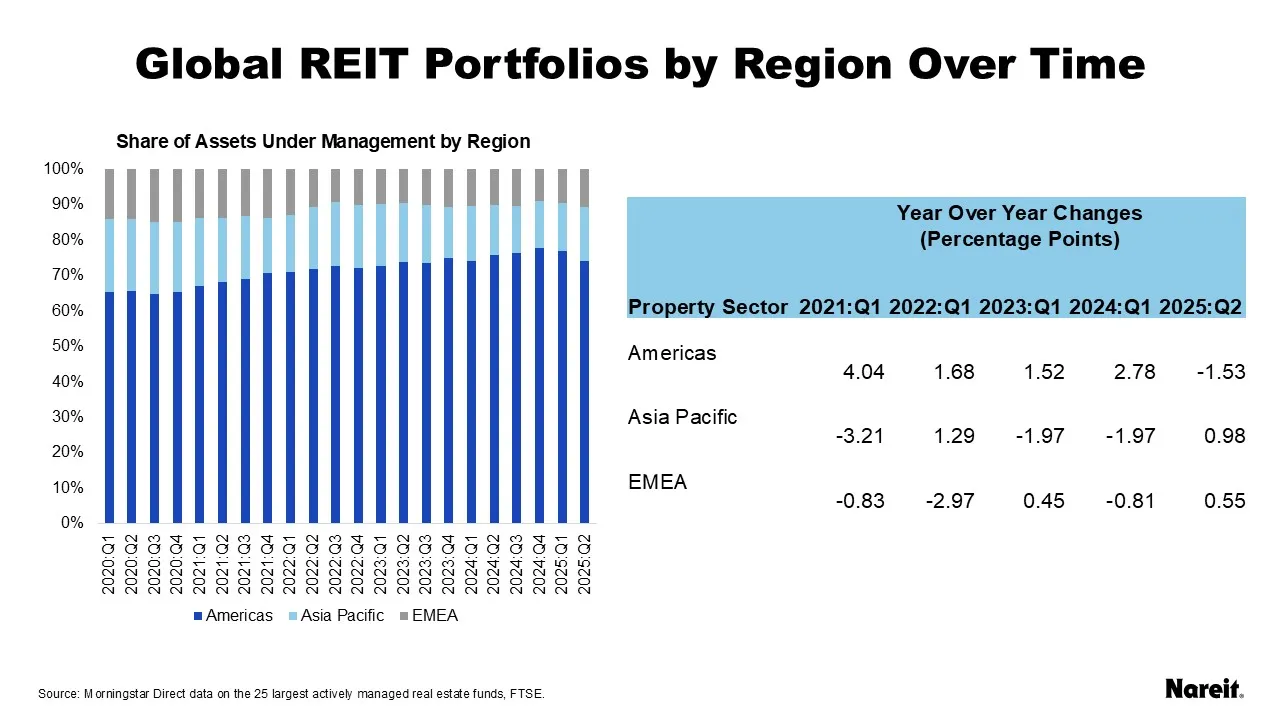
Active managers have adjusted their allocations to the three regions over time as shown in the chart above. The share in the Americas has been increasing, from 65% in 2020 to 74% as of mid-year 2025. Most of this shift has been away from the Asia Pacific region, which dropped to 15% from 21% in 2020. Annual changes over time are shown in the table. In the most recent quarter, the allocation to Americas was down year-over-year by more than 1.5 percentage points. Both Asia Pacific and EMEA increased their shares, with Asia Pacific taking most of the share reallocation, up nearly one percentage point.
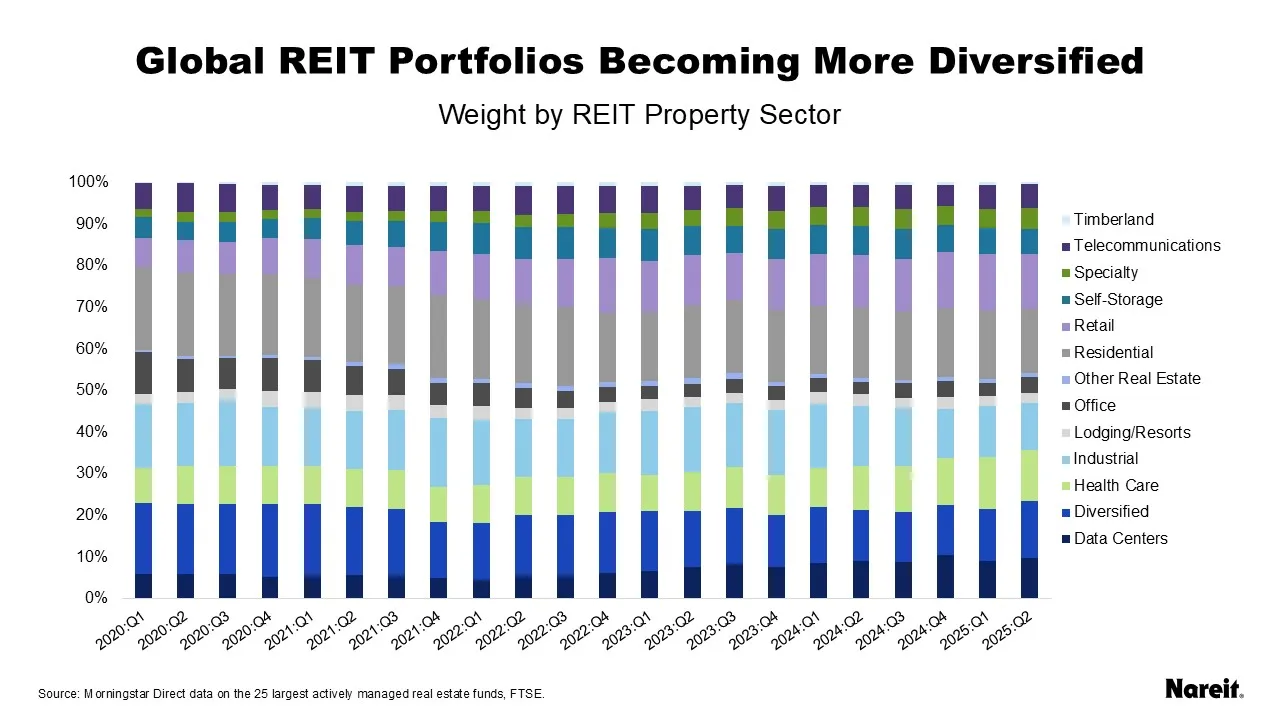
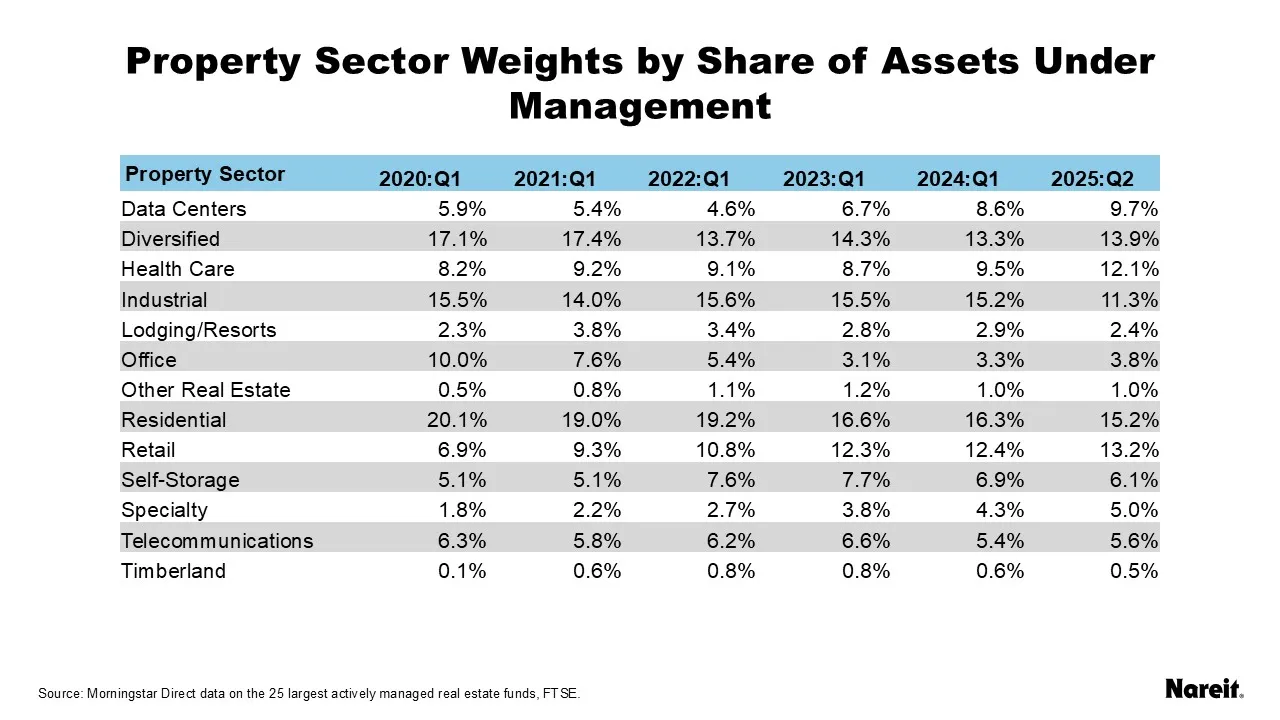
The share of real estate assets in the funds for each property sector from 2020 to the second quarter of 2025 is shown in the chart and table above.
Taking a closer look at specific sector allocations offers other key observations:
- Residential has the highest share throughout the period, although its share has been declining. Residential had a 20% share in the funds at the beginning of 2020 and is down to a 15% share mid-year 2025.
- Diversified has the second highest share throughout the period, but that has also been declining. Diversified started at 17% in 2020 and is down to 14% in 2025.
- Retail has seen the most growth over the period, an increase of more than 6 percentage points. Retail was only 7% of assets in 2020 and has increased to more than 13%.
- Data centers and health care have also seen strong growth since 2020. Both sectors are up almost 4 percentage points. Data centers has a 10% share of the funds in 2025 while health care is at 12%.
- Office has seen the largest decline over the period, down more than 6 percentage points. Office had the fourth highest allocation in 2020 at 10% and has dropped to the fourth lowest in 2025 at 4%.
- Industrial had stayed mostly around 15% until its recent drop in 2025. The sector lost more than 4 percentage points in 2025, down to an 11% share.
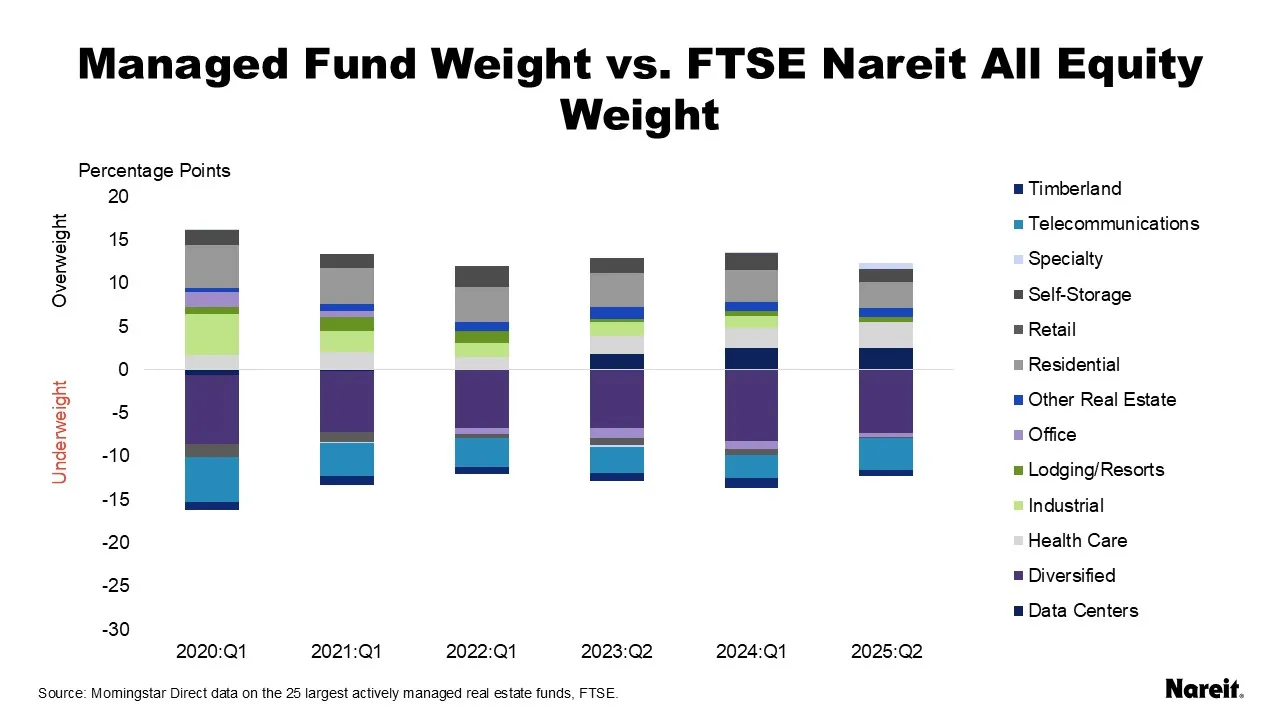
The chart above compares the share of equity market capitalization of each property sector in the FTSE EPRA Nareit Global Extended Index to the share of assets in the actively managed real estate funds. The dispersion of the bars fluctuates over time, showing periods where active managers differed most, and least, with the index. Much of that dispersion was due to the large overweight of residential and the large underweight of diversified.
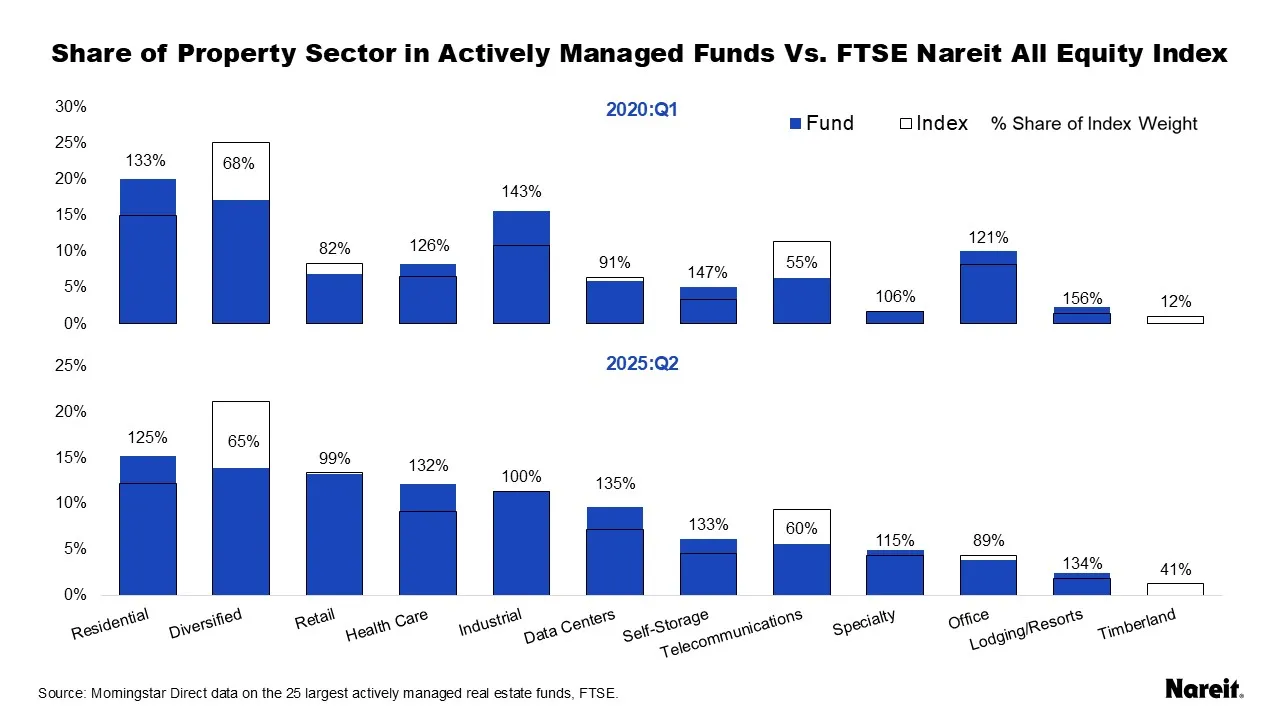
The chart above compares the weight in the actively managed funds to the weight in the index for the first quarter of 2020 and the second quarter of 2025. Both charts are sorted by each sector’s actively managed fund weight in 2025. The text gives the fund weight share of the index weight so the over(under)weight is represented proportional to its index weight.
- Residential is overweight through the entire period. At 3.1 percentage points overweight mid-year 2025, it has only the fourth largest overweight position of all the property sectors by share of its index weight. Residential’s share has been falling throughout the period.
- Data centers are the most overweight by share of index weight at 135%, followed closely by lodging/resorts at 134% of its index weight, self-storage at 133%, and health care at 132%. Like residential, health care and lodging/resorts have been overweight the entire period. Data centers were underweight or at parity until mid-2022, when they flipped overweight. Data centers have been overweight by more than 2 percentage points since 2024.
- Industrial and self-storage both started the period strongly overweight at 143% and 147% of their index shares respectively and are down in 2025. Industrial is at parity with its index share in 2025, with declines steady throughout the period. Self-storage has seen more volatility, peaking at 153% of its index share in mid-2022 and falling back to 133% in 2025.
- Telecommunications and diversified are highly underweight throughout the period. Diversified has the largest underweight compared to the index in 2025 at 7 percentage points. However this represents 65% of its index share, less underweight than telecommunications at 60% of its index share. Diversified has no clear trend over the period, shifting allocations from quarter to quarter. Telecommunications was decreasing its underweight for most of the period, up to 70% of its index share in the third quarter of 2024, but dropped in the next quarter and stayed 60% in 2025.
- Office flipped from overweight to underweight over the period while retail flipped from underweight to parity.
Active managers in global real estate can diversify both by geography and property sector to follow economic trends. Since 2020, active managers have moved their investments toward the Americas region and away from Asia Pacific. Like their U.S.-focused counterparts, global active managers have shifted toward emerging sectors like data centers and health care. However, the global difference can be seen in overweighting self-storage and lodging/resorts, unlike U.S. focused active managers.