A new tool may help you better understand real estate markets, focus on market segments or time periods, or even put together better presentations and exhibits.
NAREIT’s Real Estate Index Comparison brings together a wide array of leading sources of return measurement in the real estate market in a tool that makes it easy for you to select which measures you want to display. The tool displays returns measured by eight widely respected benchmarks:
- FTSE NAREIT PureProperty® Index Series
- FTSE NAREIT All Equity REIT Index Series
- CoStar Commercial Repeat-Sales Index (CCRSI)
- Green Street Commercial Property Price Index (Green Street CPPI)
- Moody’s/Real Capital Analytics Commercial Property Price Index (Moody’s/RCA CPPI)
- NCREIF Property Index (NPI)
- NCREIF Transaction Based Index (NTBI)
- NCREIF Open-End Diversified Core Equity Fund Index (NFI-ODCE)
Check out what you can do with the index comparison tool:
- Show measures of appreciation, net income and/or net total return.
- Choose starting dates and ending dates to focus on the recent past or another historical period of particular interest.
- Display returns for the U.S. in aggregate or for four regions (as defined by NCREIF): East, Midwest, South, and West.
- Show measures for six core and near-core property types: Apartment, Health Care, Hotel, Industrial, Office, and Retail.
- Elect whether to summarize Property returns (with no leverage) or Equity returns (incorporating the effects of leverage applied by investment managers).
- Decide whether to display monthly or quarterly data.
- Graph the selected returns, using either a linear or logarithmic scale for the vertical axis.
- Summarize cumulative returns, average annualized returns, annualized volatilities, and risk-adjusted returns (Sharpe ratios) as measured by each index.
- Toggle individual indices on or off.
- Print your chart or download it in PNG, JPEG, PDF, or SVG format to incorporate into your own presentations and documents.
To illustrate how the index comparison tool can be used, Chart 1 compares several measures of property appreciation (“App”) nationwide for all property types on an unlevered or property basis (“Nat, All, Property”) during the real estate market downturn and liquidity crisis, which started as early as 2007Q1 by some measures and ended as late as 2010Q1 by others. (To facilitate comparisons, each index is normalized to take the value 100 at its peak during the pre-crisis period.)
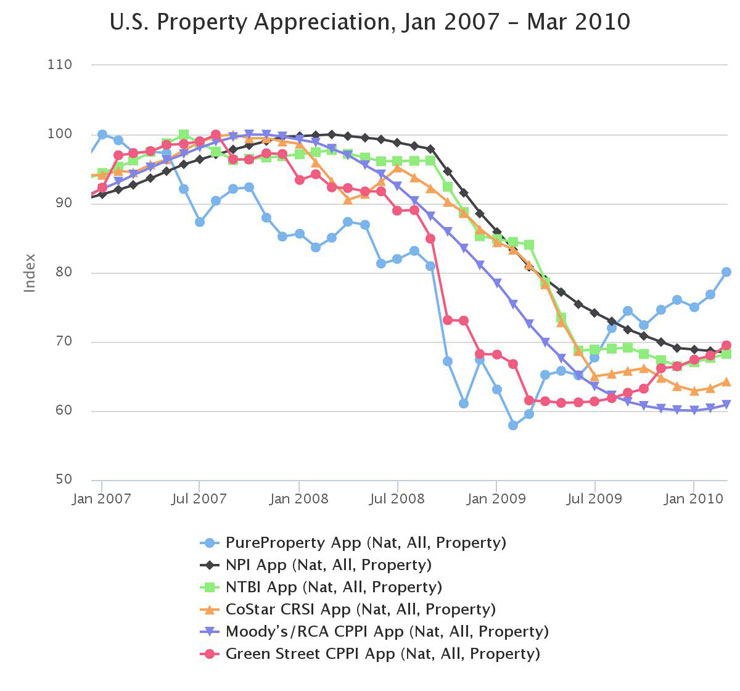
- Property values implied by stock prices in the public real estate market as measured by the FTSE NAREIT PureProperty Index (blue lines with dots) reached a peak at the end of January 2007 and a trough at the end of February 2009. During the downturn property values declined by -42.1%, but from the trough through March 2010 they had partially recovered for a cumulative decline over the selected time period of -19.9% (-6.77% per year).
- The Moody’s/RCA CPPI (indigo line with triangles) recorded an almost identical decline of -40.1% from peak to trough, but identified a much later market peak in November 2007 and a correspondingly later trough in January 2010. The Moody’s/RCA CPPI measures prices paid in completed property transactions, which lag behind up-to-date market values due to the illiquidity of private real estate.
- The Green Street CPPI (red line with dots), based both on transaction prices and estimated values of properties owned by REITs, recorded a peak-to-trough decline of -38.8% between August 2007 and May 2009.
- The CoStar CRSI (gold line with triangles) measured the decline at -37.6% between September 2007 and January 2010. The CCRSI uses a repeat-sales methodology similar to that of the Moody’s/RCA CPPI but does not employ the same moving average to smooth the measured returns.
- The NTBI (green line with squares), based on transaction prices of properties owned by NCREIF data contributing members, showed a decline of -33.5% from the second quarter of 2007 through the fourth quarter of 2009.
- Finally, the NCREIF Property Index (black line with diamonds) measured the decline at -31.5% from a peak in 2008Q1 to a trough in 2010Q1. The NPI is computed from property appraisals, which lag behind both market values and transaction prices because of the additional time required to conduct appraisals using data from completed transactions on comparable properties.
Chart 2 shows how the index comparison tool can be used to focus on a segment of the market—in this case real estate in the Midwest Region over the entire available historical time period from 2002Q3 through 2016Q2. This chart displays three available indices on a logarithmic scale:
- The FTSE NAREIT PureProperty Index (blue) measured property-level net total returns averaging 7.54% per year (compounded) with annualized volatility of 10.81%, a Sharpe ratio of 0.62, and a peak-to-trough decline of 32.28%.
- The NCREIF Transaction Based Index (green) estimated returns averaging 6.32% per year with annualized volatility of 10.10%, a Sharpe ratio of 0.54, and a peak-to-trough decline of 28.64%.
- The NCREIF Property Index (black) compiled appraisals suggesting net total returns of 6.81% per year with annualized volatility of just 4.37% for a Sharpe ratio of 1.26 and a peak-to-trough decline of 19.96%.
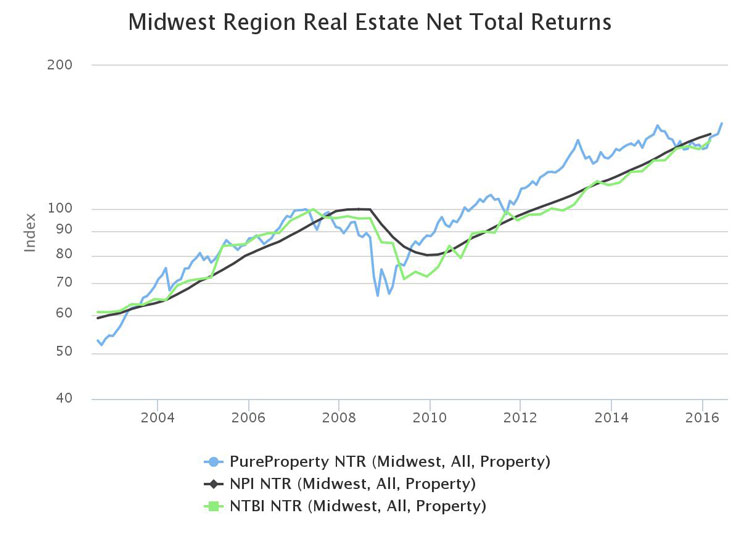
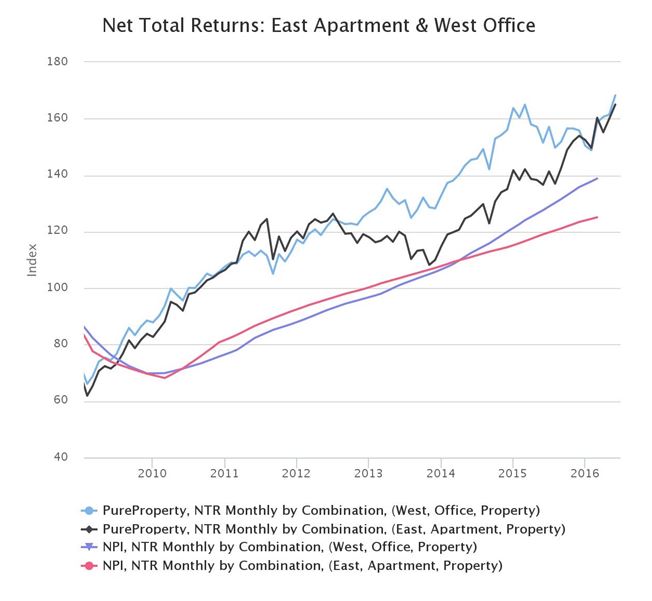
Chart 3 compares two market segments—East Region Apartment investments and West Region Office investments—over the period since the bottom of the liquidity crisis in 2009Q1 using the two available measures of returns for segments targeted by both region and property type, the FTSE NAREIT PureProperty Index and the NCREIF Property Index. The chart clearly shows the widely recognized reporting lag afflicting the NCREIF Property Index, with the bottom of the market for both segments not appearing in the NPI until 2010Q1. Perhaps even more interesting, both the PureProperty Index Series and the NCREIF Property Index show that that the East Region Apartment segment began markedly underperforming West Region Office—with the PureProperty Index revealing the underperformance beginning in 2012Q3 while the NPI revealed it beginning in 2013Q3 after the normal four-quarter reporting lag—but only the PureProperty Index Series shows the performance gap between the two market segments having closed more recently, beginning in 2015Q2.
NAREIT’s index comparison tool is intended to make it easier to draw genuine insights by comparing measures of performance in different segments of the real estate market. How will you use it to help prepare your next presentation?