Despite elevated economic uncertainty and financial market volatility, REIT operational performance has maintained resilience. Recent data from Nareit’s REIT Industry Tracker show that, on average, REITs have continued to deliver solid year-over-year net operating income (NOI) and same store NOI growth rates. These are welcome outcomes in an uncertain time.
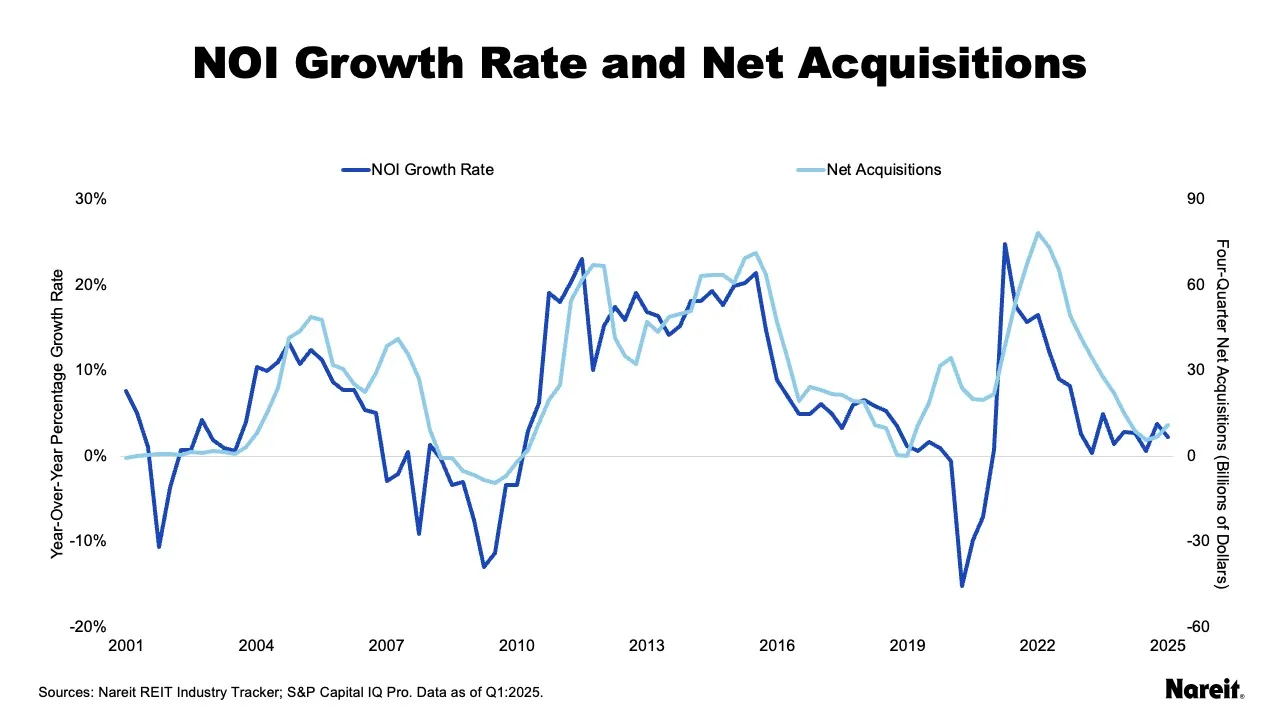
The chart above presents year-over-year NOI growth rates, and rolling four-quarter net acquisitions for U.S. public equity REITs, from the first quarter of 2001 to the first quarter of 2025 from Nareit’s quarterly REIT Industry Tracker. While the year-over-year NOI growth rates help account for seasonality in the data, they do not control for REITs’ transaction activities.
Historically, REIT NOI growth rates and net acquisitions have exhibited wide amplitudes. They have also displayed a positive relationship with one another. Thus, high NOI growth rates have tended to be associated with elevated levels of REIT net acquisitions, and vice versa. The current commercial real estate transaction market has been characterized by limited activity. In this environment, REITs have still been able to post solid operational performance. As of the first quarter of 2025, the equity REIT year-over-year NOI growth rate was 2.3%.
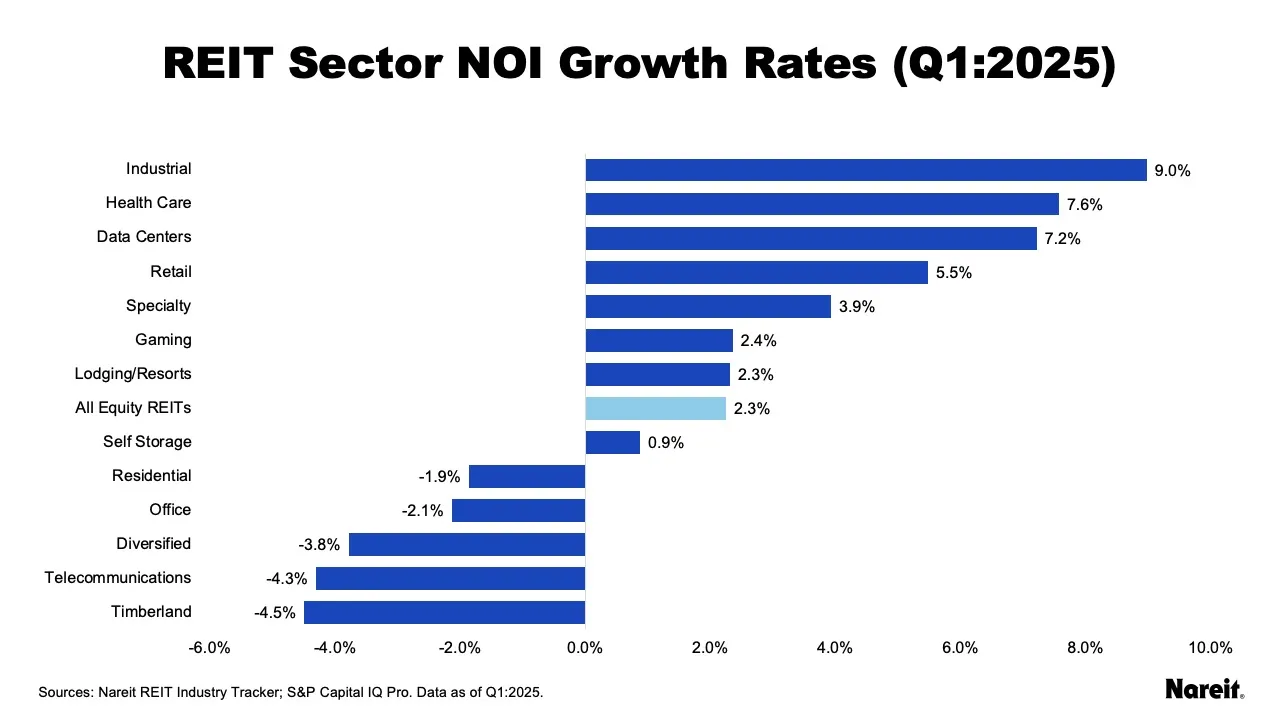
Using data from Nareit’s REIT Industry Tracker, the chart above exhibits year-over-year NOI growth rates for REIT sectors in the first quarter of 2025. Operational performance across sectors was widely dispersed, with eight of 13 sectors posting positive NOI growth rates. Retail, health care, and industrial were among the top sectors for NOI gains; they were also the largest net buyers over the past four quarters. Office, telecommunications, and diversified were among the weakest operational performers; they were also the largest net sellers over the past year.
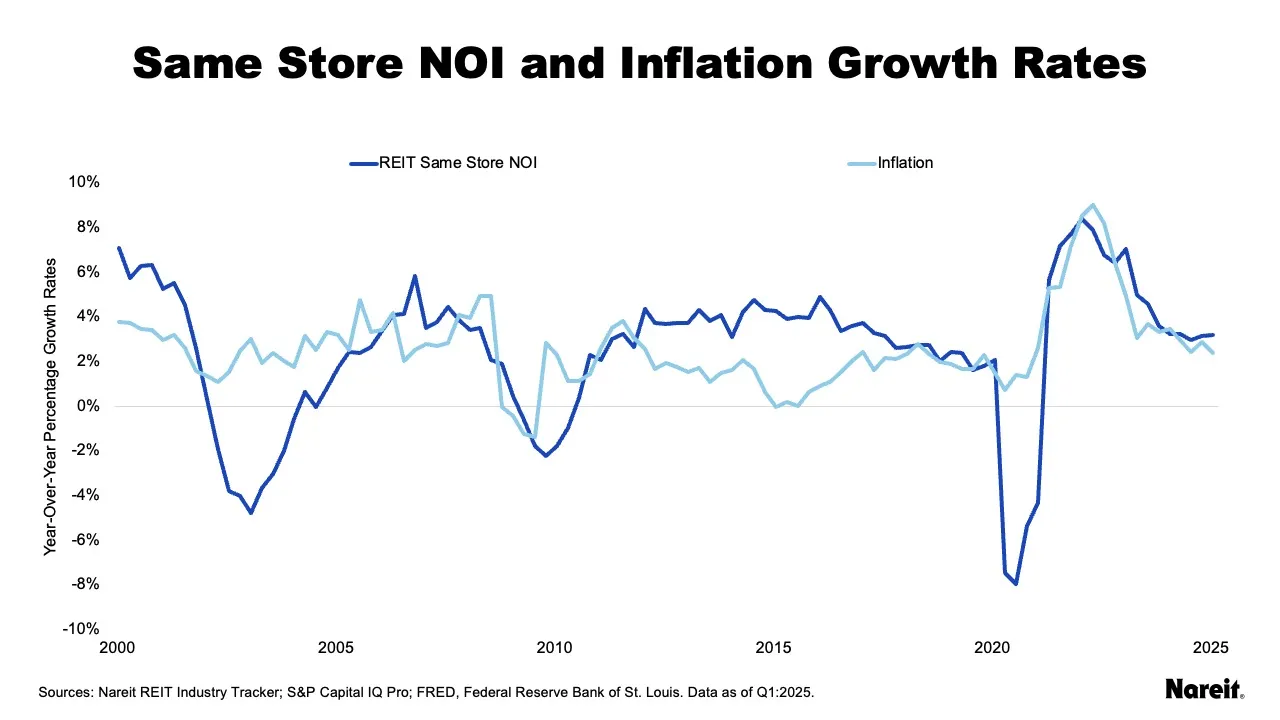
The chart above displays year-over-year same store NOI growth rates for U.S. public equity REITs from the first quarter of 2001 to the first quarter of 2025, using data from Nareit’s REIT Industry Tracker. It also presents seasonally-adjusted year ago inflation rates from the Consumer Price Index for All Urban Consumers (CPI) over the same time frame. While same store NOI is typically viewed as providing a cleaner, apples-to-apples comparison, not all REITs report it. This metric is only available for seven of 13 sectors in Nareit’s REIT Industry Tracker.
The chart exhibits a positive correlation between REIT same store NOI growth and inflation rates. In the latter half of the examined time period, REIT operational growth exceeded inflation approximately 80% of the time; it had only done so roughly 40% of the time in the prior half. From the third quarter of 2012 to the first quarter of 2025, REIT same store NOI growth and inflation rates averaged 3.3% and 2.6%, respectively. In the first quarter of 2025 (the most recent data available), the growth rate for same store NOI was 3.2%; it was 2.4% for inflation.
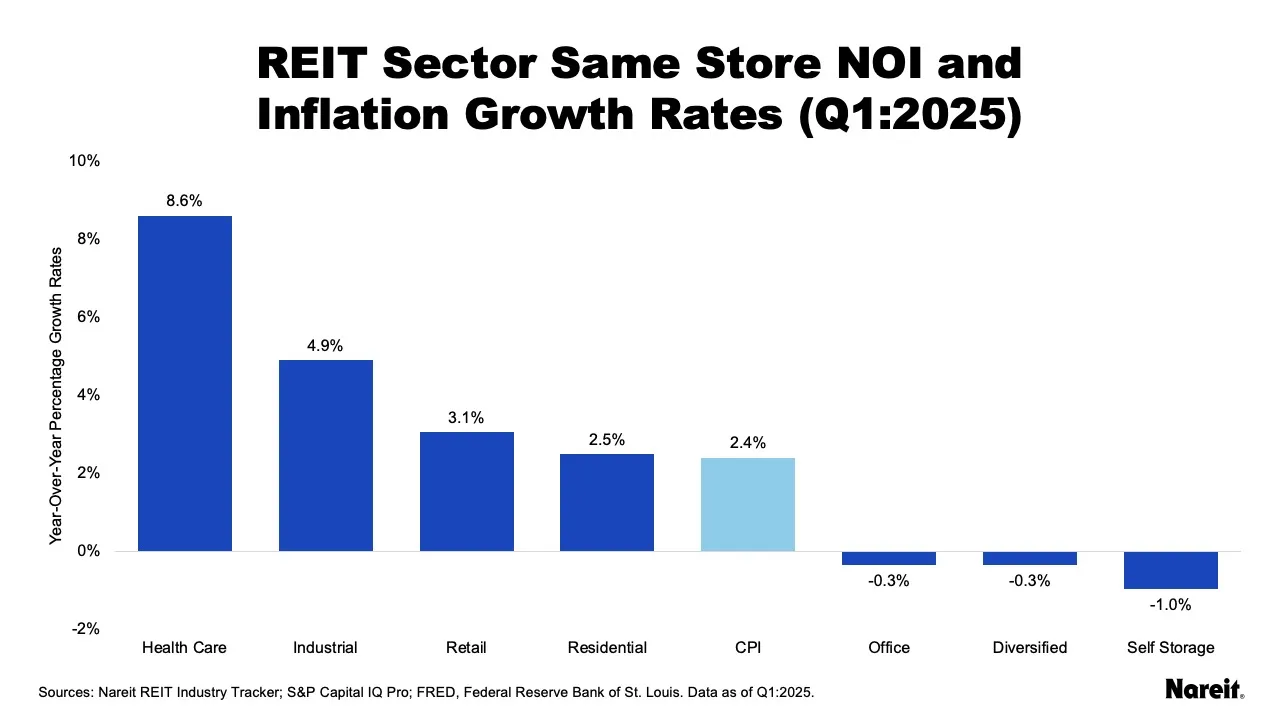
The chart above shows same store NOI growth rates for REIT sectors with available data in Nareit’s REIT Industry Tracker and the CPI inflation rate for the first quarter of 2025. The examined REIT sectors posted widely different operational performances in the first quarter of the year. Four sectors (health care, industrial, retail, and residential) realized same store NOI growth rates greater than inflation; three sectors (office, diversified, and self-storage) did not and were modestly negative. These results are indicative of each sector’s underlying fundamentals.
In an environment that lacks clarity, REIT operational performance has maintained its resiliency. REITs have continued to deliver solid NOI growth and REIT same store NOI growth has kept pace with inflation. These results highlight REITs’ prowess when it comes to asset selection and management. With solid operations and strong balance sheets, REITs are in an enviable position, facing less stress and enjoying greater flexibility than many of their counterparts.