The pandemic had a significant impact on demand for commercial real estate in the third quarter, resulting in rising vacancy rates and slowing or falling rents and property prices. The impact was uneven across property types, however, with greater effects on office and retail property markets, but smaller or little impact on multifamily and industrial properties.
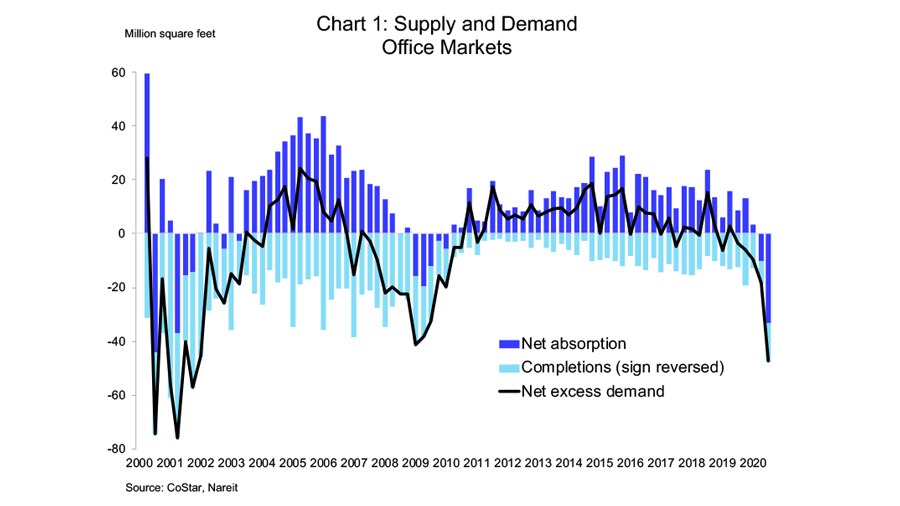
Demand for office space fell sharply in the third quarter, as total occupied space declined 33 million square feet (dark blue bars in chart 1).
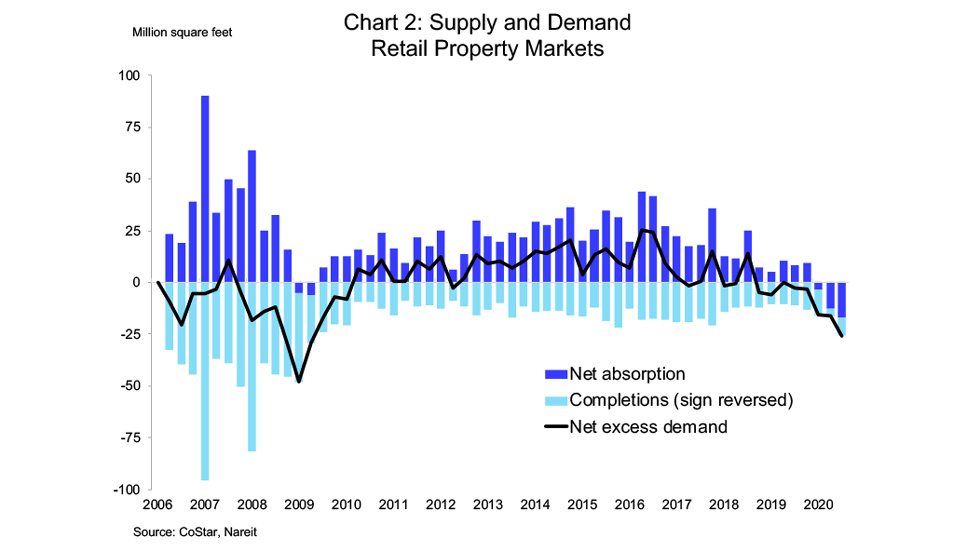
This is a larger decline than in any quarter during the financial crisis 2008-2009, and the largest decline since 2001. Retail property markets also saw a sharp drop in occupied space due to store closures and retailer bankruptcies. Total leased space fell 17 million square feet.
For both office and retail markets, the low level of new construction (light blue bars in charts 1 and 2, with sign reversed to show completions as a negative) compared to past downturns did buffer somewhat the impact of falling demand. New office supply in the first quarter was less than two-thirds the average during the first half of 2009; for retail, new supply was one-quarter the pace in 2009.
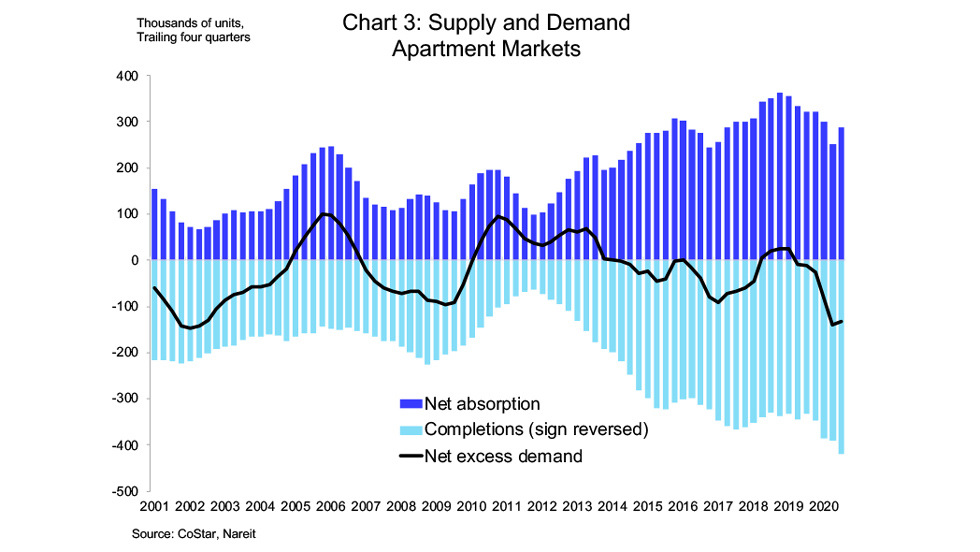
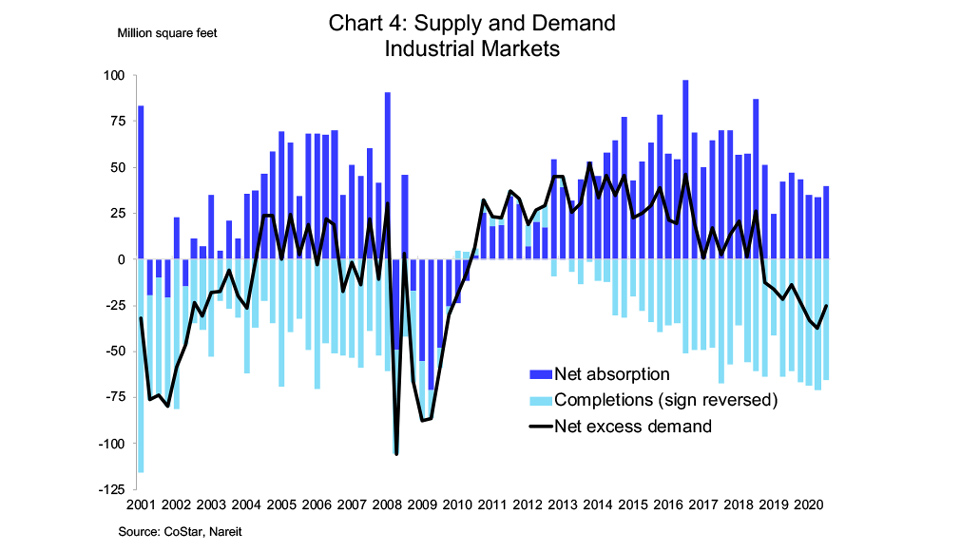
Demand continued to rise in apartment and industrial markets, albeit by less than the new construction delivered during the quarter. For apartments, net absorption over the past four quarters actually picked up a bit relative to Q2, but still fell short of new supply (chart 3; there is a strong seasonal leasing pattern in apartments, so this chart is shown as the sum of net absorption over four quarters). Net absorption of industrial properties was 40.2 million square feet, about two-thirds the average pace from 2016-2019.
Despite the relative strength in the industrial market, demand fell short of national new supply by 25.4 million square feet.
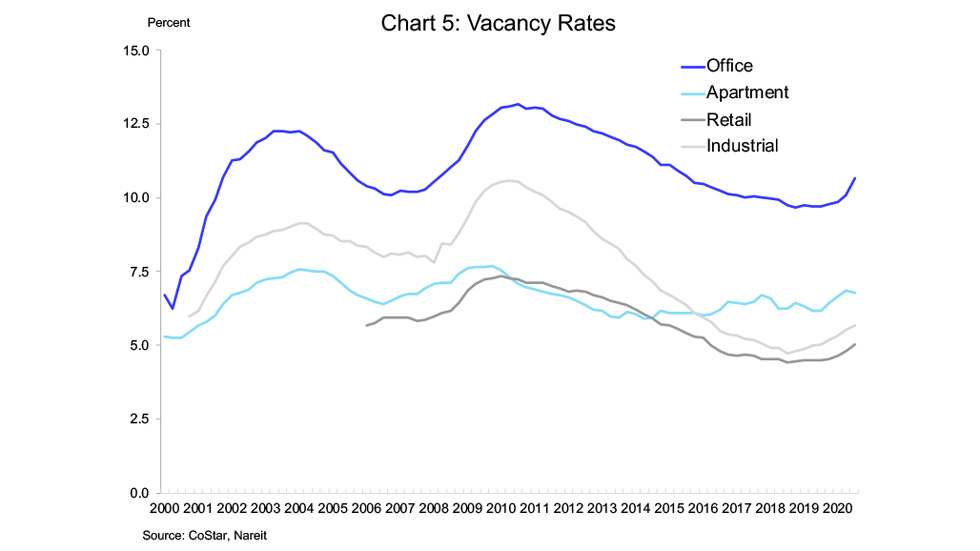
Vacancy rates moved up in most major property markets due to weaker demand. Office markets experienced the largest increase, with vacancy rates 60 bps higher than at mid-year and 90 bps higher than the end of 2019. Retail vacancy rates were 20 bps higher than last quarter and 50 bps higher than end of 2019. There was a slight in increase in industrial vacancies, rising 10 bps, while apartment vacancies were little changed from last quarter.
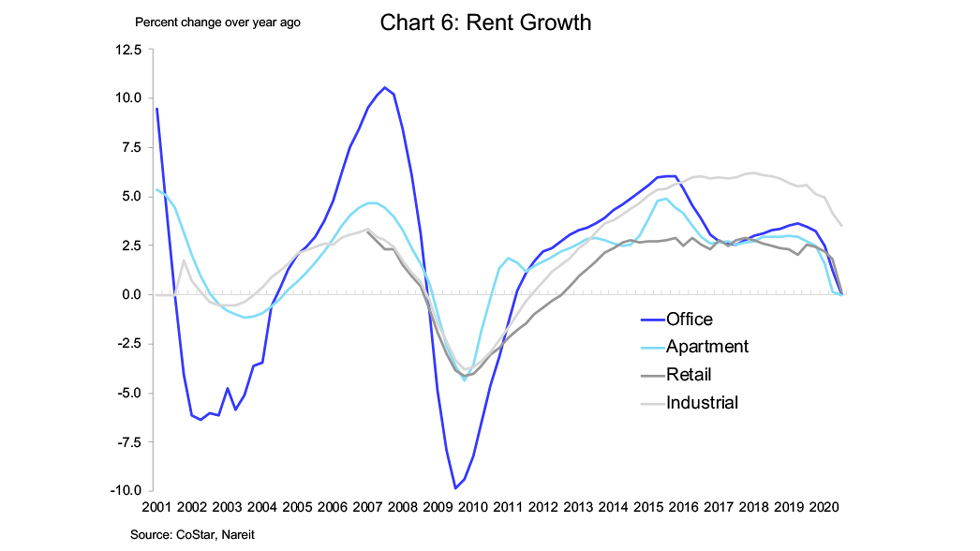
Rent growth slowed or turned negative due to the weakness in demand for leased space. Office rents dropped 0.5%, the second consecutive decline after a 0.3% decrease in the second. Retail rents were down 0.6%, while apartment rents slipped 0.2%. Industrial was the only major property sector with a quarterly rise in rents, posting a 0.8% increase. For office, retail, and apartments, declines since the start of the pandemic reversed the gains late last year, leaving rents little changed from one year earlier. Industrial rents, in contrast, are 3.5% higher than in the third quarter of 2019.
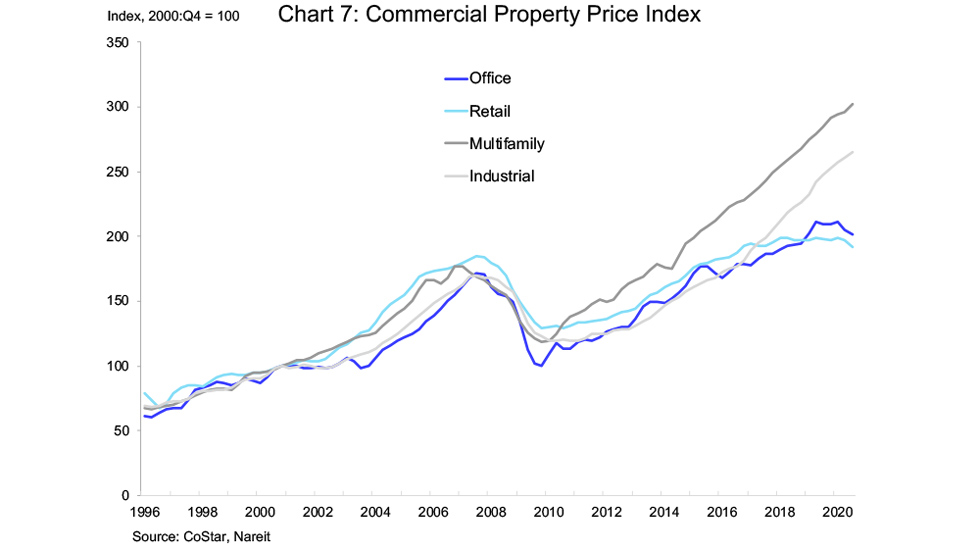
Property prices reflect these trends in demand and rents. For office and retail properties, prices as measured by the CoStar commercial repeat sales index show declines of 3.8% and 3.2%, respectively, from one year ago. Prices of industrial and apartment properties, in contrast, continued rising, and are 7.1% and 6.3% higher, respectively, than the third quarter of 2019.
