During this period of divergent public and private property valuations, the commercial real estate mortgage market has been marked by higher interest rates and stricter underwriting standards. While U.S. public equity REITs are not immune from the current mortgage market turmoil, data from Nareit’s Total REIT Industry Tracker Series (T-Tracker®) for the second quarter of 2023 show that they have limited their exposure to these challenges by maintaining leverage ratios consistent with core investment strategies and focusing on unsecured and fixed rate debt.
On average:
- Leverage ratios remained modest with debt-to-market assets below 35%.
- Percentage of total debt at a fixed rate was 91%.
- Percentage of total debt that was unsecured was 79%, providing REITs with a competitive advantage over many of their private property market counterparts.
A review of the 13 equity REIT property sectors from the FTSE Nareit All Equity Index, as well as an aggregate index measure, highlights the differences in the levels and types of debt REITs utilize to implement their investment strategies. Comparisons of current measures to those during the Global Financial Crisis (GFC) also reveal REITs’ shifting attitudes toward balance sheet structure. Across the sectors, REITs have dramatically reduced their leverage ratios since the GFC and increasingly focused on fixed rate and unsecured debt. This has placed them in an enviable position given the capital and mortgage market turmoil in the current real estate investment environment.
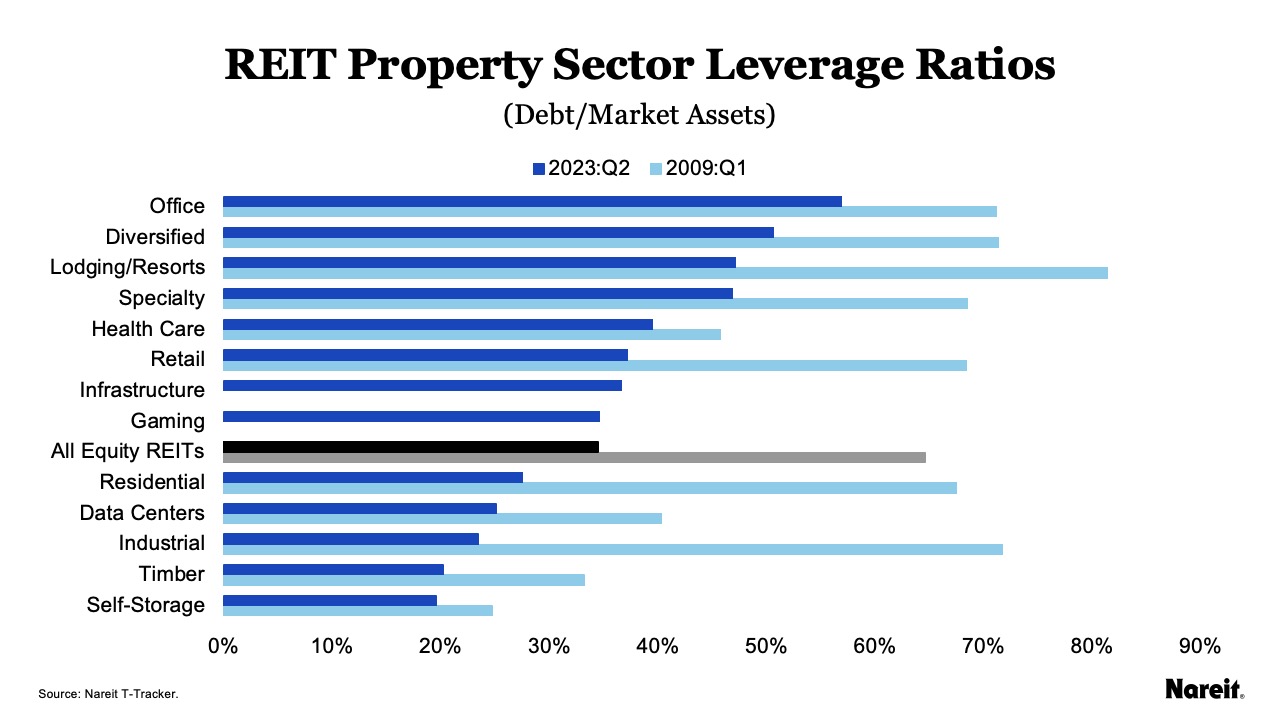
Using data from Nareit’s T-Tracker, the chart above displays U.S. public equity REIT leverage (debt-to-market assets) ratios from the first quarter of 2009 (amid the GFC) and second quarter of 2023 (the most recent data available) by REIT property sectors; it also includes an aggregate average of debt-to-market assets. Data were unavailable for the infrastructure and gaming sectors in the first quarter of 2009.
Across each of the sectors with available data, leverage ratios have dropped dramatically since the GFC. At nearly 40%, the largest decline was in the residential sector. The smallest decline was in the self-storage sector at just over 5%. As of the second quarter of 2023, the office and diversified sectors were the only two property types that had leverage ratios in excess of 50%. Presently, nine of the 13 equity REIT property sectors have leverage ratios below 40%. REITs appear to have learned some valuable lessons when it comes to leverage from their experiences during the GFC. On average, most REIT sectors are currently utilizing leverage ratios that are reflective of core investment strategies.
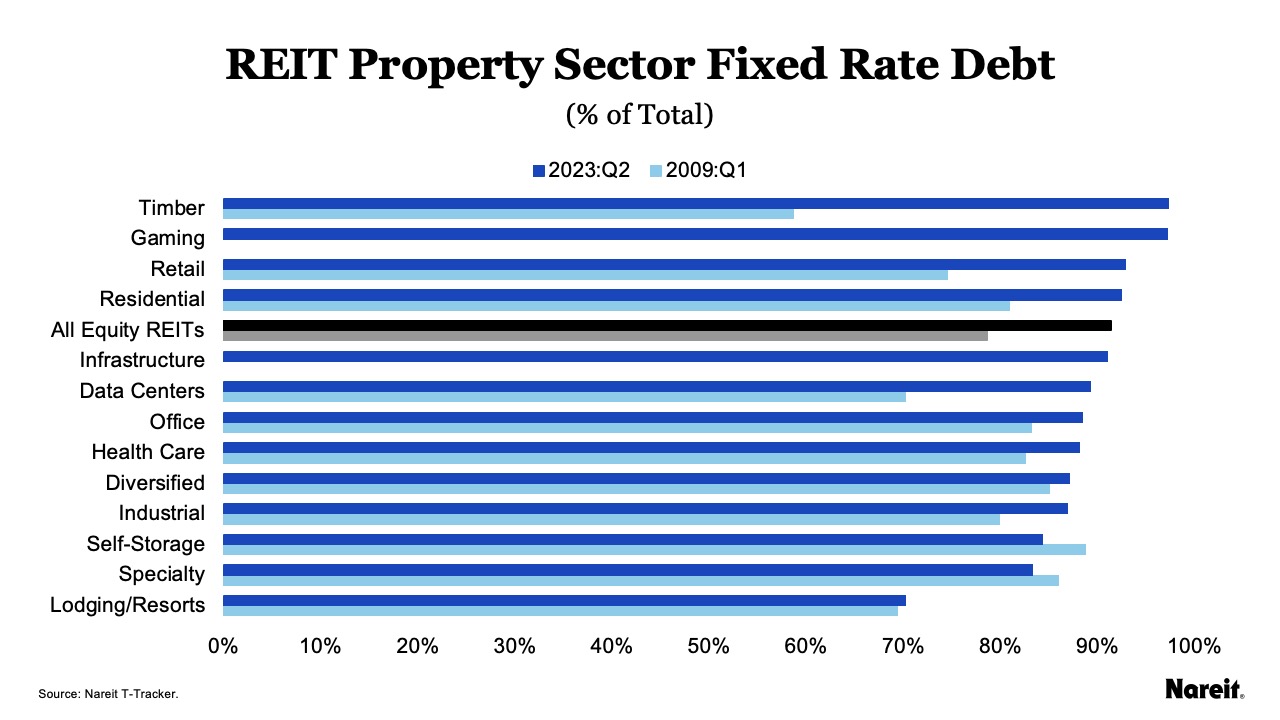
The chart above presents equity REIT property sector fixed rate debt utilization rates (as percentages of total debt) from the first quarter of 2009 (amid the GFC) and second quarter of 2023 (the most recent data available) using data from T-Tracker. In the first quarter of 2009, data were unavailable for the infrastructure and gaming sectors.
Compared to the first quarter of 2009, 11 of 13 equity REIT property sectors are utilizing greater proportions of fixed rate debt today. Fixed rate debt currently accounts for 100% of total debt for the timber and gaming sectors. Of the sectors with an uptick in fixed rate debt usage, the lodging/resorts sector had the lowest utilization; it was 70% of total debt. Self-storage and specialty sectors were the only two categories that had a drop, albeit modest, in their fixed rate debt percentages; however, both measures remained well above 80%. On average, the percentage of total debt at a fixed rate for U.S. public equity REITs was 91%. This high level of commitment to fixed rate debt highlights REITs’ long-term investment perspective.
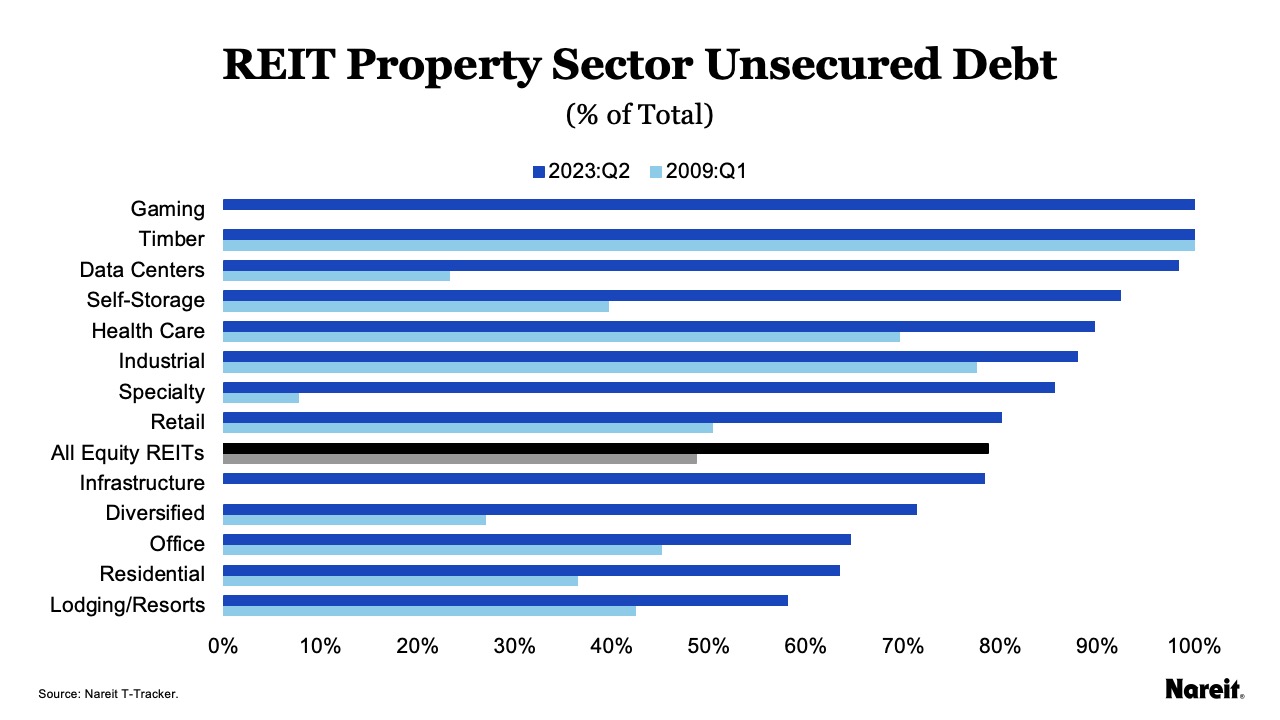
Using data from T-Tracker, the chart above shows equity REIT unsecured debt utilization rates (as percentages of total debt) from the first quarter of 2009 (amid the GFC) and second quarter of 2023 (the most recent data available) by REIT property sectors; it also includes an aggregate average. Data were unavailable for the infrastructure and gaming sectors in the first quarter of 2009.
Unsecured debt utilization rates have increased significantly since the GFC across each of the REIT property sectors with available data. This is an unsurprising result as, today, more than 85% of public equity REITs have an investment-grade bond rating. Mimicking the fixed rate debt results, unsecured debt currently accounts for 100% of total debt for the timber and gaming sectors; the lodging/resorts sector also had the lowest utilization rate. In the second quarter of 2023, nine of the 13 equity REIT property sectors had unsecured-to-total debt percentages greater than 75%. In a tumultuous time, access to the unsecured debt market has provided REITs with a competitive advantage over many of their private real estate market counterparts.
The charts shine lights on the current state of REIT sector-specific balance sheets. With typical low leverage policies focused on fixed rate and unsecured debt, REITs are ably handling tighter credit conditions and the ongoing high interest rate environment. Solid balance sheets remain another reason why investors should stay attuned to REITs’ tactical and strategic opportunities.