The U.S. commercial real estate market is amid an uncoupling. Property operational performance has generally been strong for both public and private real estate, but valuation metrics and total returns have diverged. As of the third quarter of 2022, the REIT implied cap rate was nearly 120 basis points higher than the private real estate cap rate. Total returns through the third quarter of 2022 for the FTSE Nareit All Equity Index and the NCREIF Fund Index–Open End Diversified Core Equity were -27.9% and 13.1%, respectively. These disparities have increased the attractiveness of public equity REITs, presenting opportunity for real estate investors. The dislocation between public and private real estate markets, however, is expected to close, most likely through changes in both REIT and private market valuations. Performance data from the fourth quarter of 2022 show that this valuation adjustment process already may have started. It will likely continue and follow a measured path throughout 2023.
Due to its pricing mechanism, public real estate tends to be more responsive to economic and financial market changes than its private market counterpart. REIT performance has typically led private real estate performance by 6 to 18 months.
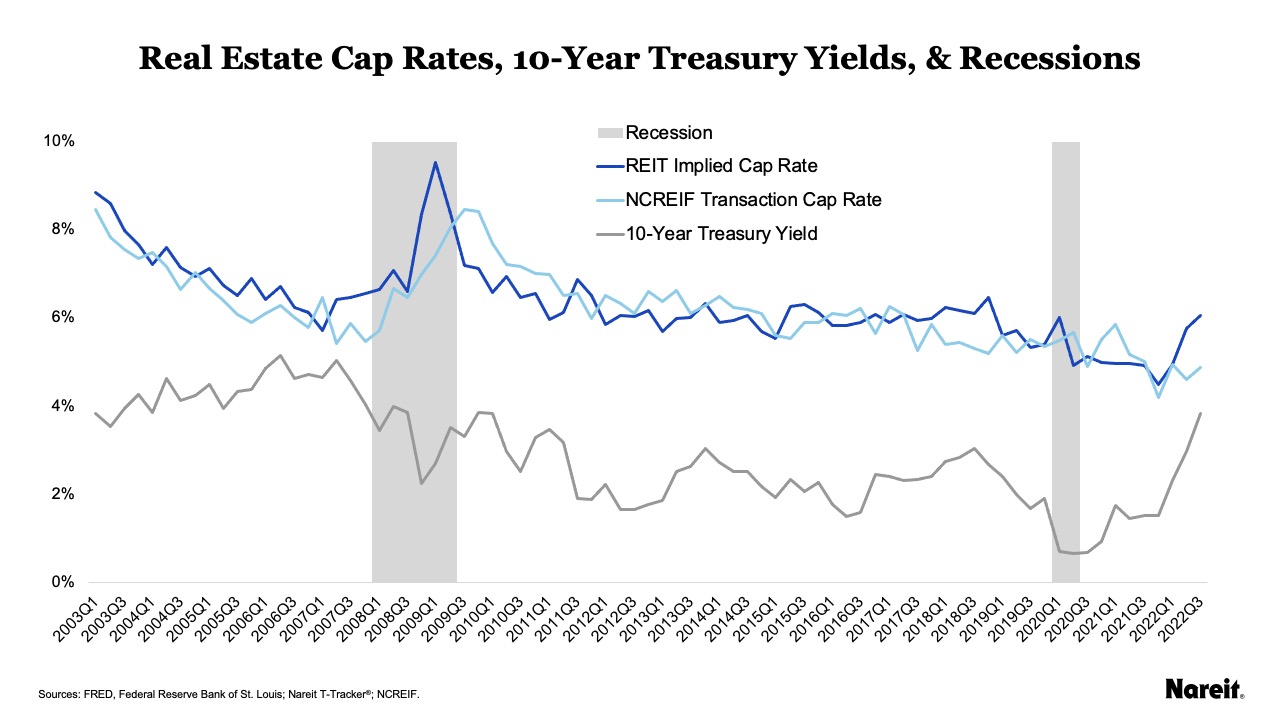
A divergence is apparent in real estate cap rates. The chart above presents quarterly public and private real estate cap rates, 10-year U.S. Treasury yields, and periods of recession from the first quarter of 2003 to the third quarter of 2022. REIT implied cap rates were sourced from Nareit T-Tracker®; and private market transaction cap rates were obtained from the National Council of Real Estate Investment Fiduciaries (NCREIF). The starting point for the examination period was selected due to a break in the NCREIF data.
A review of the chart shows that public and private cap rates had similar levels and movements over the examined period. The lead-lag relationship where REITs lead the private market is also evident, particularly during the first months of COVID-19 and the global financial crisis. Summary statistics reinforce these observations. The average for the REIT implied cap rate was 6.3%; it was 6.2% for the NCREIF transaction cap rate. With rounding, standard deviations were the same (0.9%) for both measures. Adjusting the private real estate cap rate time series by two quarters also materially boosted the correlation coefficient.
Although cap rates do not move in lock step with interest rates, the public real estate market had a meaningful reaction to the surge in the 10-year Treasury yield in 2022; the private market response was more measured. From the fourth quarter of 2021 to the third quarter of 2022, the 10-year Treasury yield increased by 231 basis points. Over the same time frame, the REIT implied and NCREIF transaction cap rates rose by 156 and 66 basis points, respectively.
The difference between the public and private market cap rates stood at 119 basis points in the third quarter of 2022; it averaged 12 basis points over the examination period. All else equal, this difference suggests the potential for private real estate market valuations to fall by 20% or more, but typically, all else is not equal. In 2023, the gap between public and private cap rates is expected to close, most likely through changes in both REIT and private market valuations.
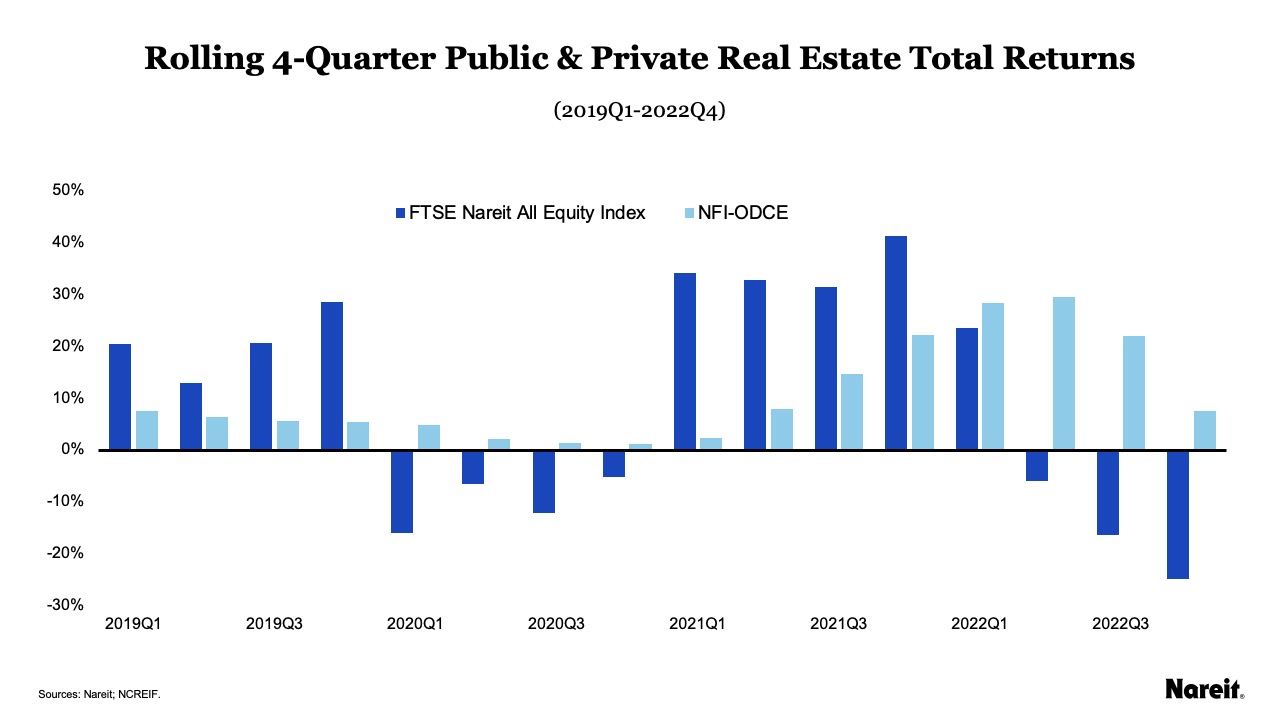
The chart above displays rolling four-quarter total returns for public and private real estate from the first quarter of 2019 to the fourth quarter of 2022. The FTSE Nareit All Equity Index and the NCREIF Fund Index–Open End Diversified Core Equity (NFI–ODCE) are utilized to measure REIT and private real estate market performances, respectively.
A divergence between REIT and private real estate total returns is also observable in 2022. The most significant difference was observed in the third quarter of 2022; FTSE Nareit posted a four-quarter total return of -16.3% and the NFI–ODCE return was 22.1%. As of the fourth quarter of 2022, the rolling four-quarter total returns for the public and private markets were -24.9% and 7.5%, respectively. These disparities provide evidence of a dislocation between the markets.
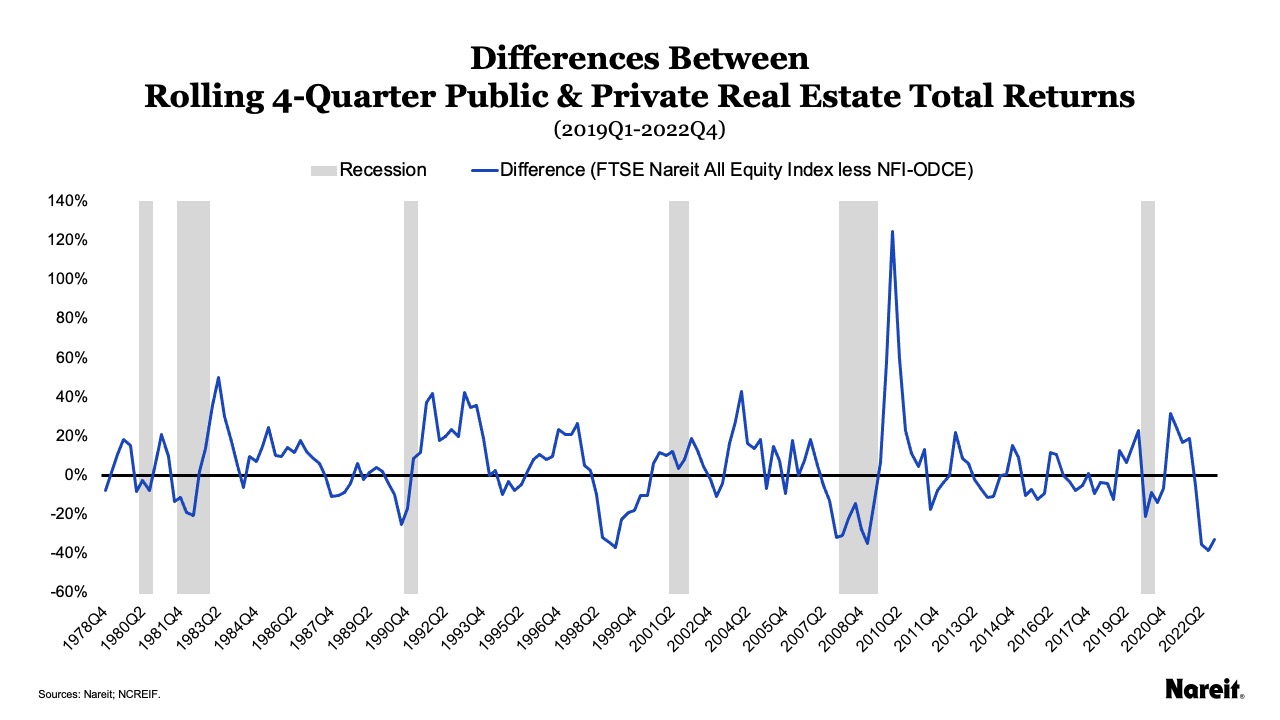
The chart above exhibits the differences between rolling four-quarter total returns for public and private real estate (FTSE Nareit All Equity Index less NFI–ODCE) from the fourth quarter of 1978 to the fourth quarter of 2022. Negative values highlight periods of REIT underperformance relative to private real estate; positive values indicate periods of REIT outperformance.
The chart reveals a pattern where REIT total returns have tended to significantly rebound after periods where they trailed the private market. The most notable instance was in the first quarter of 2010 where the spread reached 125% after an extended period of underperformance. The difference of -38.4% in the third quarter of 2022 marked the most significant level of REIT underperformance relative to private real estate in the history of the indices. Given past trends, this may signal a REIT buying opportunity for investors.
Performance data from the fourth quarter of 2022, however, show that the anticipated valuation adjustment process already may have started. In the last quarter of 2022, the equity REIT total return was 4.1%; it was -5.0% for NFI–ODCE. The resultant rolling four-quarter total return difference was -32.4%. This adjustment process will likely continue and follow a measured path throughout 2023.
The divergence in public and private real estate valuations has increased the attractiveness of REITs, presenting a potential opportunity for investors with an interest in real estate. Given their current market valuations, strong operational performance, and solid balance sheets, REITs are well-positioned to navigate the economic and market uncertainty of 2023.


