Nareit is tracking quarterly investment holdings for the 28 largest actively managed real estate investment funds focusing on REIT investment. Following actively managed portfolio allocations to different REITs and sectors gives insight into how dedicated real estate investors view the market. The analysis covers quarterly holdings by the funds starting in 2010 and ending in the first quarter of 2023. The funds have $44 billion in combined assets under management as of the first quarter of 2023, and 96.6% of assets were in REITs.
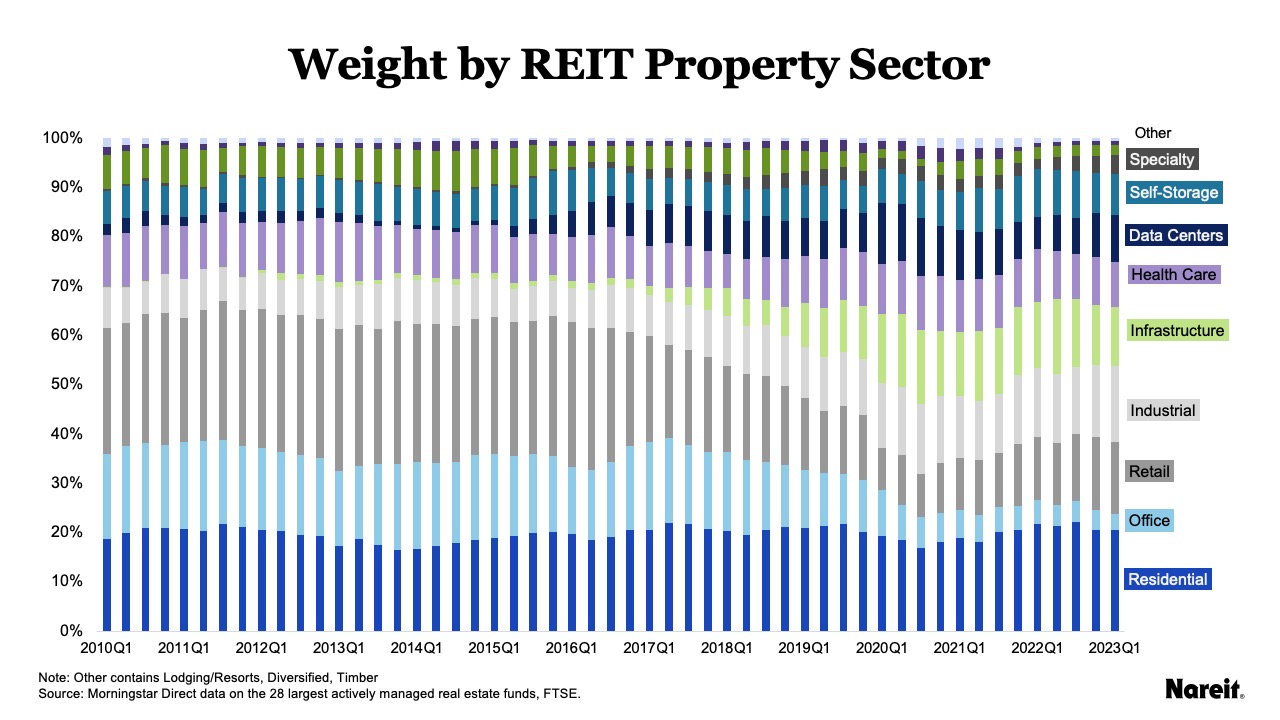
Looking at holdings over time by assets under management shows significant shifts over time in actively managed funds. The chart above shows the share of REIT assets for all the funds in each property sector on a quarterly basis from 2010 to the first quarter of 2023. Within REITs, residential remains the property sector with the highest share among the funds with a consistent share averaging 20%. For the traditional sectors, retail and office investment has shrunk over this period, with retail at 25% at the beginning of 2010 and office at 17%; and now at 15% and 3% respectively. In their place, real estate funds have grown shares in industrial, infrastructure, and data centers.
Using assets under management skews results to larger funds and high market value REITs. On average, the funds held 40 names in the first quarter of 2023, with one fund holding as few as 27 and another fund holding as many as 140. Generally, fund holdings are in the 35-40 name range, with the median at 36.5.
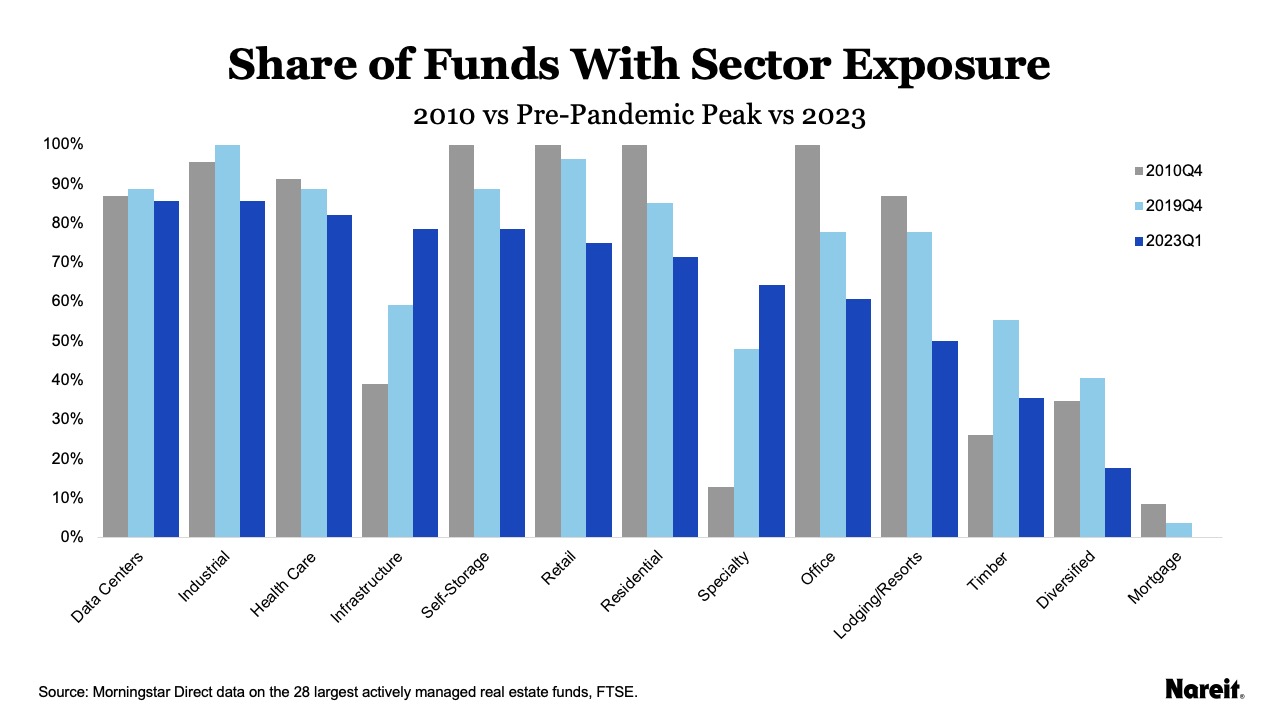
By property sector, the chart above shows the exposure in the funds over time. Property sector exposure is shown as a share of total funds for the beginning of 2010, the end of 2019, and the beginning of 2023. This chart shows the popularity of sectors in actively managed funds rather than the value of the exposure.
- At the end of 2010, residential, retail, and self-storage had 100% coverage in the funds, while infrastructure was at less than 5% and timber had 18% coverage.
- In 2019, only industrial had 100% in the funds, followed by retail, missing in only one fund, data centers, health care, and self-storage (89% of funds).
- In 2023, industrial and data centers maintained their relative popularity (86% of funds), followed by health care (82%), infrastructure, and self-storage (79%).
Comparing the count of funds to the asset weights shows that although residential has the highest share of assets under management, the property sector falls short of investment by all 28 funds. Conversely, self-storage’s share of assets has been quite small due to their smaller market cap, but has been consistently one of the most popular sectors in which funds have invested.
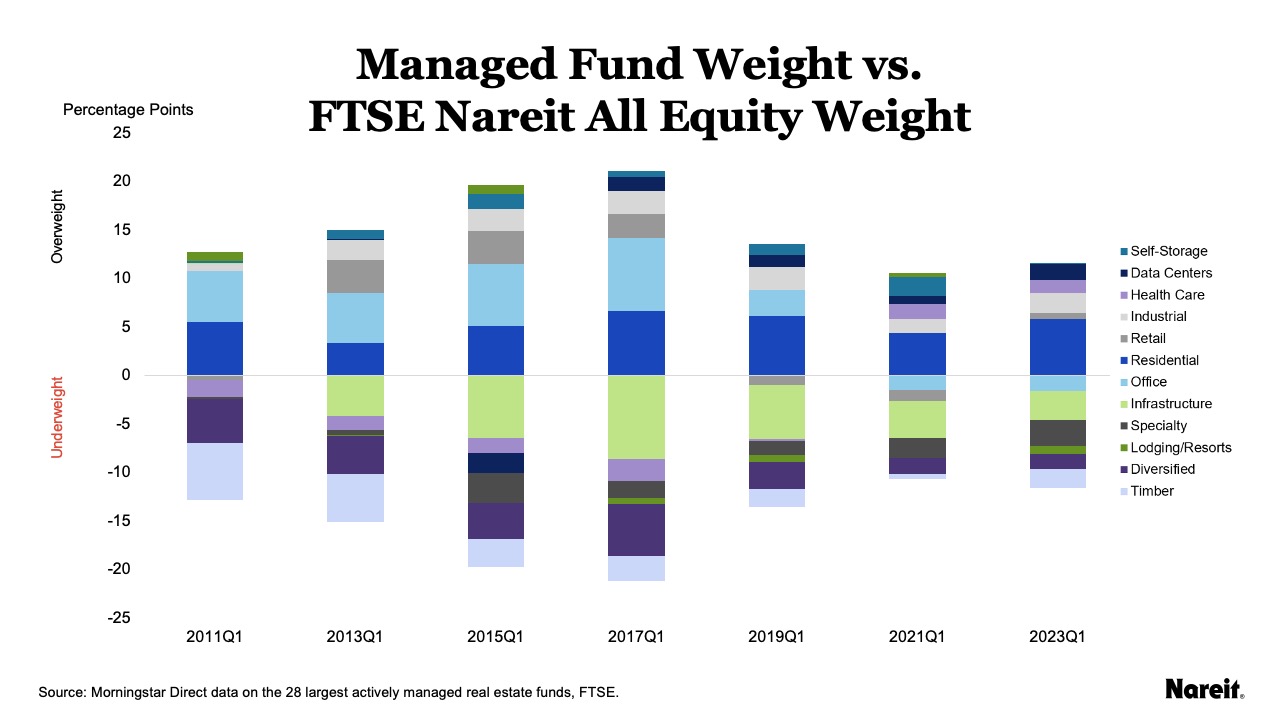
Yet another way to track how actively managed funds are investing in property sectors is to compare the weight in each sector to their share of equity market capitalization in the FTSE Nareit All Equity Index. The chart above shows biannual snapshots from 2011 to 2023 of the weightings comparison for the actively managed funds. Over- and under-weightings by actively managed funds indicate expert opinions on the market by investment managers.
- Residential remains overweighted through the time period, with a six percentage point difference between the weight in the funds and the index in the first quarter of 2023.
- Industrial is also overweighted through the period, growing more overweighted since 2022 while also increasing its weight in the All Equity Index.
- Infrastructure (encompassing cell towers) is persistently underweighted, although the gap narrowed to 2.9 percentage points in 2023 from seven percentage points at the end of 2015. This may be less a reflection of active manager’s expectations for the sector and more a byproduct of using benchmarks that specifically exclude cell tower REITs.
- The actively managed funds began to reduce office’s share in the second quarter of 2018, but the funds remained overweighted in office until the second quarter of 2020. Most recently, office is very slightly underweighted by less than two percentage points.
- Data centers, lodging/resorts, and self-storage have all stayed close to their Index weights.
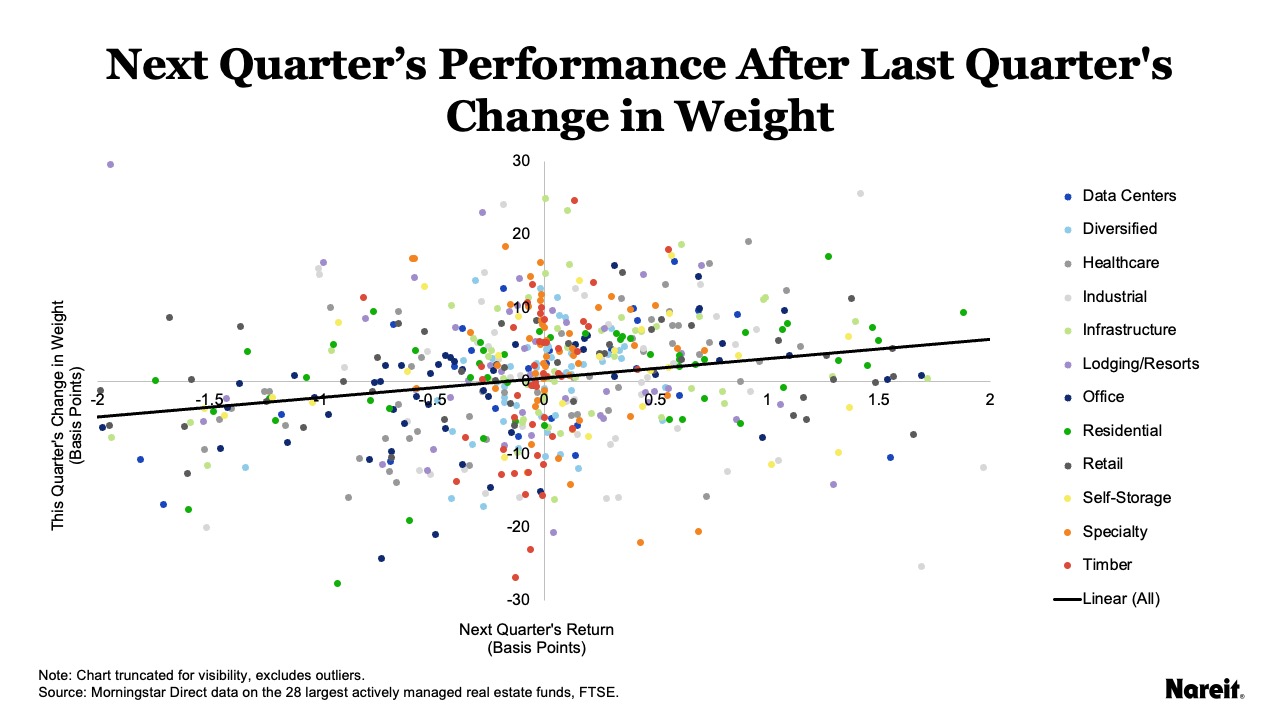
Looking at how sector weights change from quarter to quarter shows fund managers do increase or reduce sector exposure the quarter before the sector outperforms or underperforms the FTSE Nareit All Equity Index. The chart above shows quarterly changes in the funds’ weight plotted against the performance of each sector in the next quarter, measured as the percentage point difference between the sector quarterly return and the All Equity quarterly return.
The trend line across all sectors shows a one basis point increase (or decrease) in a property sector’s weight is associated with a statistically significant three basis points of outperformance (or underperformance) by that property sector over the All Equity Index in the next quarter. This correlation is stronger for some sectors than others. In particular, weight changes are strongly correlated with future performance for data centers (0.67), office (0.50), timber (0.48), and residential (0.45).
Shifts in allocations over time indicate expert expectations for the commercial real estate market and the economy at large. By tracking allocations, fund exposure, and performance for actively managed funds on a quarterly basis, Nareit can highlight this expertise.