Actively managed generalist funds tend to be underweight in real estate and REITs. This analysis shows that in active funds benchmarked to broad based stock indexes, the average active allocation is smaller than the average passive allocation from the benchmark. However, this REIT underweight has been narrowing over time. In the fourth quarter of 2016, generalist funds benchmarked against the S&P 500 were 1.5 percentage points underweight in real estate, but are only 0.5 percentage points underweight in the first quarter of 2025.
The gap between the benchmark and the active funds’ allocations to real estate is calculated using Morningstar Direct data on the share allocated to equity in the real estate GICS sector (which is nearly all REITs) for U.S. registered mutual funds and ETFs tied to major benchmarks.
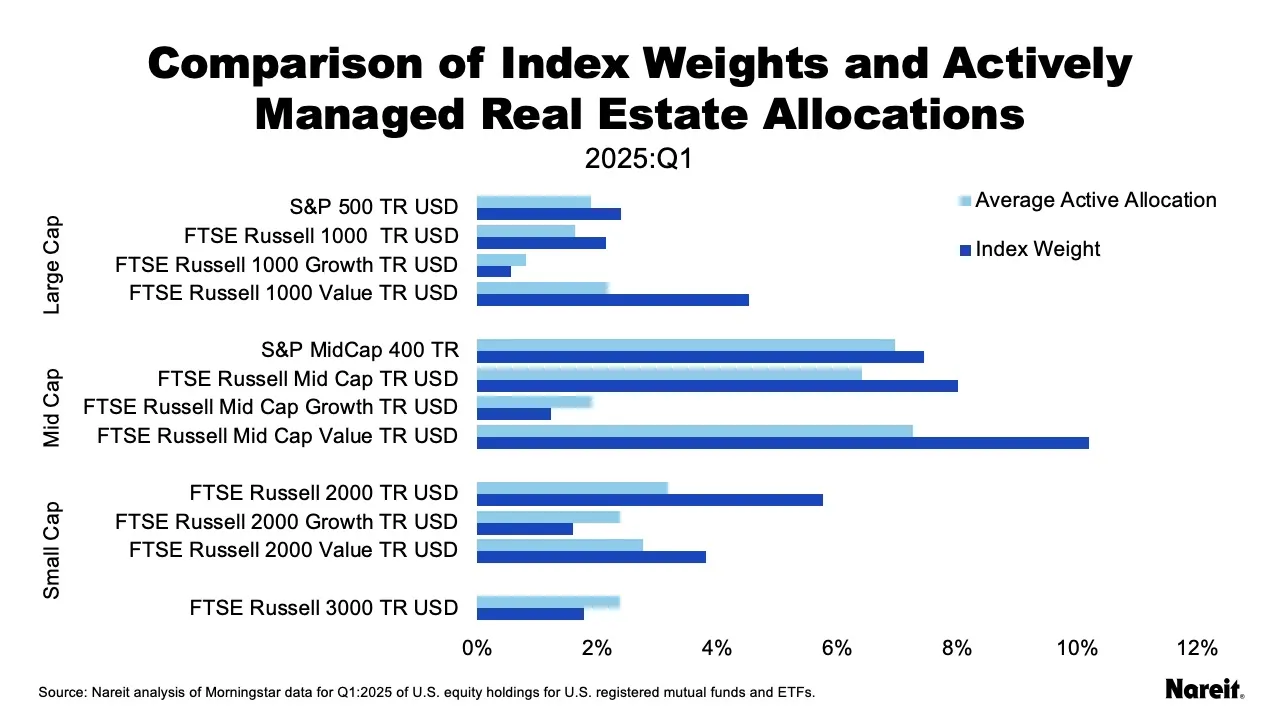
The active allocation weight for each benchmark index is the asset-weighted average of active funds benchmarked to that index. The chart above shows the average weight of real estate in the benchmark index in dark blue and the average allocation in actively managed funds tied to that benchmark in light blue. In most cases, actively managed funds are underweighting real estate.
For the two widely used large cap benchmarks, the S&P 500 and the FTSE Russell 1000, real estate is underweight by half a percentage point. In the three growth indexes, real estate active holdings are overweight versus the relatively small index weight. For example, in the case of the FTSE Russell Mid Cap Growth index, the average index weight of real estate is 1.2% and the average active allocation is 1.9%. In contrast, in the three value indexes, real estate active allocations are underweight to relatively large index allocations. For example, the FTSE Russell Mid Cap Value index, the average index weight is 10.2% and the average active allocation is 7.3%.
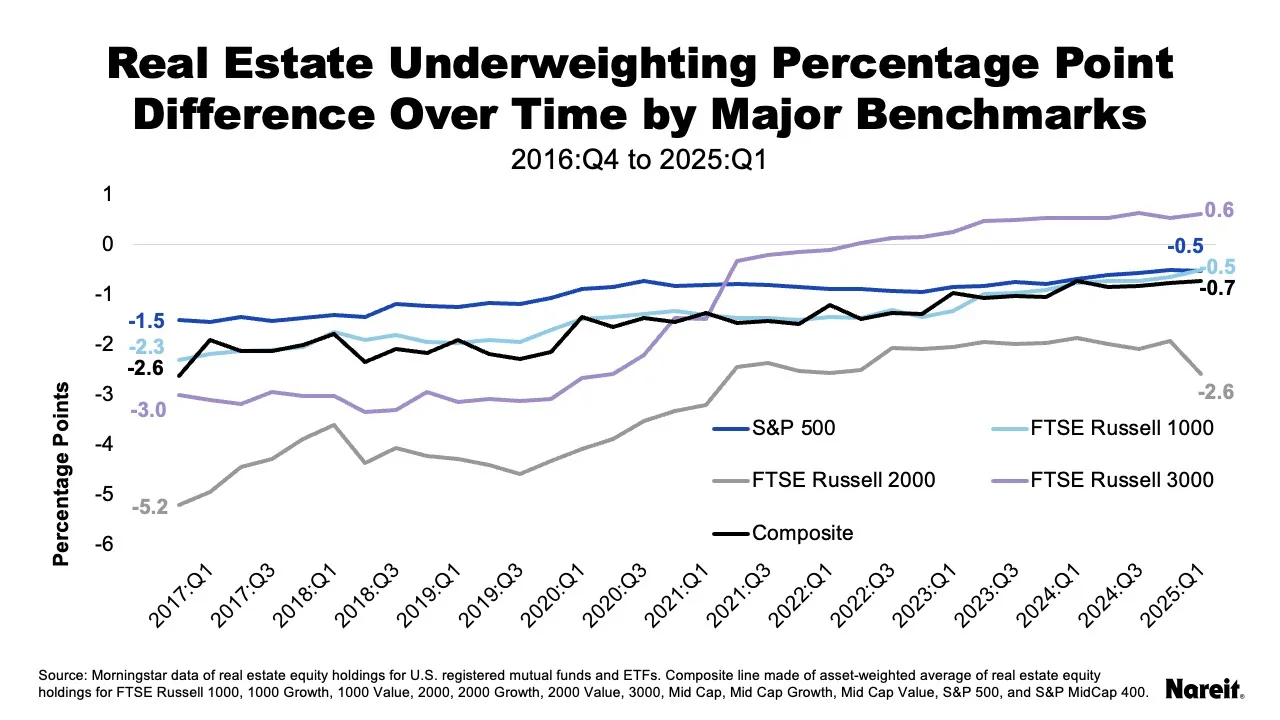
The gap between the average active allocation and the average index allocation has narrowed over time. The chart above shows the difference between the two allocations plotted quarterly over time for the major indexes. A composite of funds benchmarked to major indexes, including growth and value style funds, shows the overall trend in the chart.
The S&P 500, Russell 1000 and Russell 2000 are all within a percentage point difference from their index weights at the beginning of 2025, down from over two percentage points at the end of 2016. The composite represents 12 benchmark indexes and nearly 1,400 funds with over $9 trillion in assets at the beginning of 2025. The composite was underweight in REITs by 2.6 percentage points at year-end 2016 improving to 0.7 percentage points in 2025.
- The S&P 500 index result reflects 380 actively managed funds benchmarked to the index with $4.7 trillion in assets under management in 2025. The index had the highest active allocation to real estate for much of the time period, until funds benchmarked to the Russell 3000 overtook the S&P 500 in the second quarter of 2021. The S&P 500 ended 2025 underweight by 0.5 percentage points.
- The Russell 1000 index result reflects 96 actively managed funds with $416 billion in assets under management. The FTSE Russell 1000 funds started at a much greater underweight in 2016 than the S&P 500 with a 2.3 percentage point underweight, yet gained ground in real estate to end equal to the S7P 500 with a 0.5 percentage point underweight in 2025.
- The Russell 2000 result reflects 46 actively managed funds with $59 billion in assets under management. The Russell 2000 has the most variation in fund allocations to real estate and the largest improvement in the REIT underweight, a gain of 2.6 percentage points from 2016 to 2025.
- The Russell 3000 index result reflects 384 actively managed funds with $1 trillion in assets under management. Representing both small and large cap funds, the Russell 3000 funds had the largest underweight of the most common indexes, double that of the S&P 500 at 3 percentage points. However, the Russell 3000 increased its allocation until it flipped to parity in the second quarter of 2022. At the beginning of 2025, the Russell 3000 was overweight in real estate by 0.6 percentage points.