Macroeconomic data generally suggest that the U.S. economy remains in an extended period of soft growth and soft inflation—in fact, Federal Reserve officials have signaled their intent to continue monetary stimulus and tolerate slightly higher inflation to protect against further macro weakening. Over the past 44 years we’ve seen a variety of growth/inflation scenarios—including roaring times when overheated growth pushed inflation to high levels, periods of relatively good growth but with low inflation, and stagflation episodes when weak growth coincided with high inflation, as well as low-growth, low-inflation times such as now.
There are reasonable arguments in favor of pushing for stronger macroeconomic growth even when it might increase inflation pressures: For real estate investors, for example, stronger growth can generally be expected to increase occupancy rates, (nominal) rent growth and therefore net operating income, while higher inflation would reduce the real cost of repaying debt. There are equally reasonable arguments in favor of keeping inflation in check even when it might hold back the growth rate. For example, extended macroeconomic stability may reduce the possibility of igniting new bubbles in lending or construction.
How have REIT investors fared in past periods of strong or weak macroeconomic growth, and high or low price inflation? To answer this question, I used data on nominal growth in Gross Domestic Product (GDP) and consumer price inflation (CPI) to define four macroeconomic “regimes” since the beginning of 1972, when NAREIT first started collecting data on the returns to exchange-traded Equity REIT investments:
- Above-Median-Growth, Above-Median-Inflation quarters were those in which GDP growth exceeded 1.43% (5.71% on an annualized basis) and inflation exceeded 0.80% (3.18% annualized). We’ve seen 58 quarters like that one, mostly during 1972-1980: For example, in 1978Q2 GDP grew at a blistering pace of +5.8% (+23.2% annualized!) while inflation raged at +2.5% (+10.1% annualized). In all of these quarters both growth and inflation exceeded their median values, even if they might not have been thought of as “high.”
- Above-Median-Growth, Below-Median-Inflation quarters had GDP growth greater than 1.43% but inflation less than 0.80%. We’ve seen 30 such quarters since REIT returns data first became available, most commonly during the 1990s: For example, 1997Q2 showed GDP growth at a healthy +1.8% (+7.1% annualized) but inflation relatively low at just +0.3% (+1.0% annualized).
- Below-Median-Growth, Above-Median-Inflation quarters have also happened 30 times, most commonly during the first decade of this century: For example, in 2009Q2 the economy actually contracted with GDP growth at -0.3% (-1.2% annualized) while inflation was higher than normal at +1.1% (+4.3% annualized).
- Below-Median-Growth, Below-Median-Inflation quarters have happened 58 times and have tended to predominate more recently: For example, the extreme was 2015Q1 when weak GDP growth of just +0.2% (+0.8% annualized) combined with price deflation at -0.3% (-1.0% annualized).
It turns out that the current macroeconomic environment—one in which soft macroeconomic growth combines with low price inflation—has historically been the sweet spot for REIT investors. The graph shows average annualized real total returns—that is, average total returns minus the inflation rate—for exchange-traded Equity REITs and the broad stock market during each of the four “regimes.” The worst type of economy, for REIT as well as stock investors, has tended to be the above-median-growth, above-median-inflation environment typical of the 1970s. During those quarters, total returns on exchange-traded Equity REITs averaged just 3.8 percent per year more than the inflation rate, and stock investors did even worse with total returns just 2.0 percent per year more than the inflation on average.
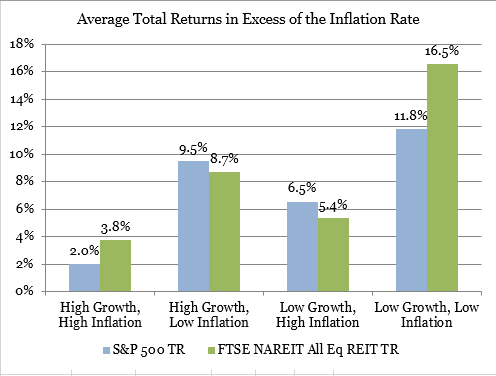
The below-median-growth, above-median-inflation environment typical of the early 21st century has generally been somewhat better, with REIT investors gaining an average of 5.4 percent per year in real terms, while stock investors did slightly better at 6.5 percent per year. Similarly, during the above-median-growth, below-median-inflation environment typical of the 1990s, REIT investors earned total returns 8.7 percent per year more than the inflation rate on average, while stock investors enjoyed slightly higher average real returns of 9.5 percent per year.
It’s in quarters similar to the current below-median-growth, below-median-inflation environment, however, that REITs have really proved their worth in investor portfolios. During quarters when annualized GDP growth was less than 5.71% and annualized inflation less than 3.18%, the total returns from investments in exchange-traded Equity REITs have beaten the inflation rate by a stunning 16.5 percent per year, on average. (And that’s even including 2008Q4 and 2009Q1, the two quarters of the liquidity crisis.)
Those quarters were solid for stock investors, too, with returns beating inflation by 11.8 percent per year on average; still, REIT investors did better than investors in non-REIT stocks by an average of 4.7 percent per year when the economy grew slowly and inflation was under control. To put that kind of performance difference into perspective, a starting portfolio of $10,000 earning the stock market average of 2.96 percent per quarter (11.8 percent per year) over 58 quarters would have grown to $54,169—but the same starting portfolio earning the REIT average of 4.13 percent per quarter (16.5 percent per year) over the same 58 quarters would have grown nearly twice as much, to $104,804.
The next table compares not just average returns, but also volatilities, correlations and risk-adjusted returns across the four macroeconomic regimes. During the 58 above-median-growth, above-median-inflation quarters, REITs were slightly more volatile than stocks (15.9% vs 15.5%), but more than made up for it in higher returns, so the Sharpe ratio measuring risk-adjusted returns was higher for REITs (0.23) than for stocks (0.12).
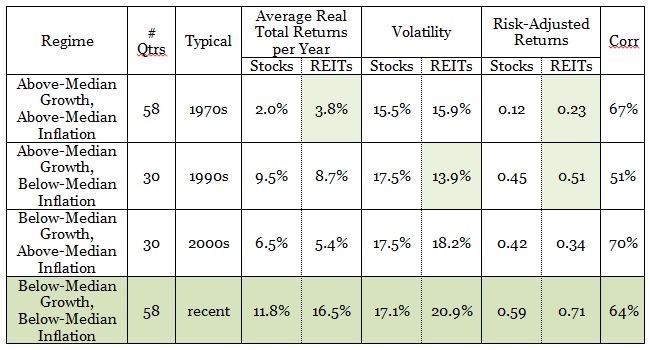
During the above-median-growth, below-median-inflation regime, REITs were less volatile than stocks (13.9% vs 17.5%), which resulted in better risk-adjusted returns (0.51 vs 0.45), even though REIT returns were slightly lower. During the below-median-growth, above-median-inflation regime REITs were slightly more volatile than stocks (18.2% vs 17.5%) and provided slightly weaker risk-adjusted returns (0.34 vs 0.42).
Again, the “sweet spot” of low growth and low inflation stands out, with risk-adjusted returns much higher for REITs than for stocks (0.71 vs 0.59) because of the large difference in average returns, even though REITs were more volatile (20.9% vs 17.1%).
Also worth noting is that the REIT-stock correlation remained low in all four regimes, topping out at just 70% during below-median-growth, above-median-inflation quarters and reaching its low of 51% during below-median-inflation, above-median-growth quarters. Even a 70% correlation indicates the very strong diversification benefits of adding REITs to a stock portfolio, but in the most common regimes—above-median-growth, above-median-inflation (58 quarters) and below-median-growth, below-median-inflation (also 58 quarters), during both of which the risk-adjusted returns of REITs beat those of stocks handsomely—the REIT-stock correlations were just 67% and 64% respectively and the diversification benefits of REITs were even stronger.
It’s hard to tell how long the current below-median-growth, below-median-inflation environment will persist, and still harder to tell how closely investment returns in the future will match those observed in the past. But a look at the stellar returns during past macroeconomic regimes similar to the most recent past have to help REIT investors gain confidence in the wisdom of their portfolio choices.
Technical notes: I measured macroeconomic growth using data from the Bureau of Economic Analysis on Gross Domestic Product (GDP), and inflation using data from the Bureau of Labor Statistics on the Consumer Price Index. I identified each quarter as below-median or above-median-growth simply according to whether the GDP growth rate was lower or higher than the median value of 1.43% (that’s 5.71% on an annualized basis) observed over the available historical period 1972Q1-2015Q4, and I defined below-median and above-median-inflation quarters relative to the median value of 0.80% (3.18% annualized) over the same period. I used the FTSE NAREIT All Equity REITs Index to measure REIT returns, and the S&P 500 Stock Index to measure stock returns. The S&P 500 measures large-cap stocks, but the Russell 3000 index of the total stock market began in January 1979, and for this analysis, I didn’t want to lose the above-median-growth, above-median-inflation quarters of 1972-1978; the correlation between the Russell 3000 and the S&P 500 over the available months is 99.3%.