REITs are real estate. Yet, at times, public and private real estate total returns have materially diverged, like they did last year. In the third quarter of 2022, the FTSE Nareit All Equity Index and NCREIF Fund Index–Open End Diversified Core Equity posted rolling four-quarter total returns of -16.3% and 22.1%, respectively; a difference of -38.4%. This delta marked the most significant degree of REIT relative underperformance in the history of the indices. The uncoupling of the public and private real estate markets has created an interesting property investment environment, making some investors anxious. While the severity and duration of this dislocation remain uncertain, a review of historical market dynamics shows that REIT returns have tended to bounce back and even surge after periods of relative underperformance. Furthermore, REIT recoveries have tended to be stronger with more extreme divergences.
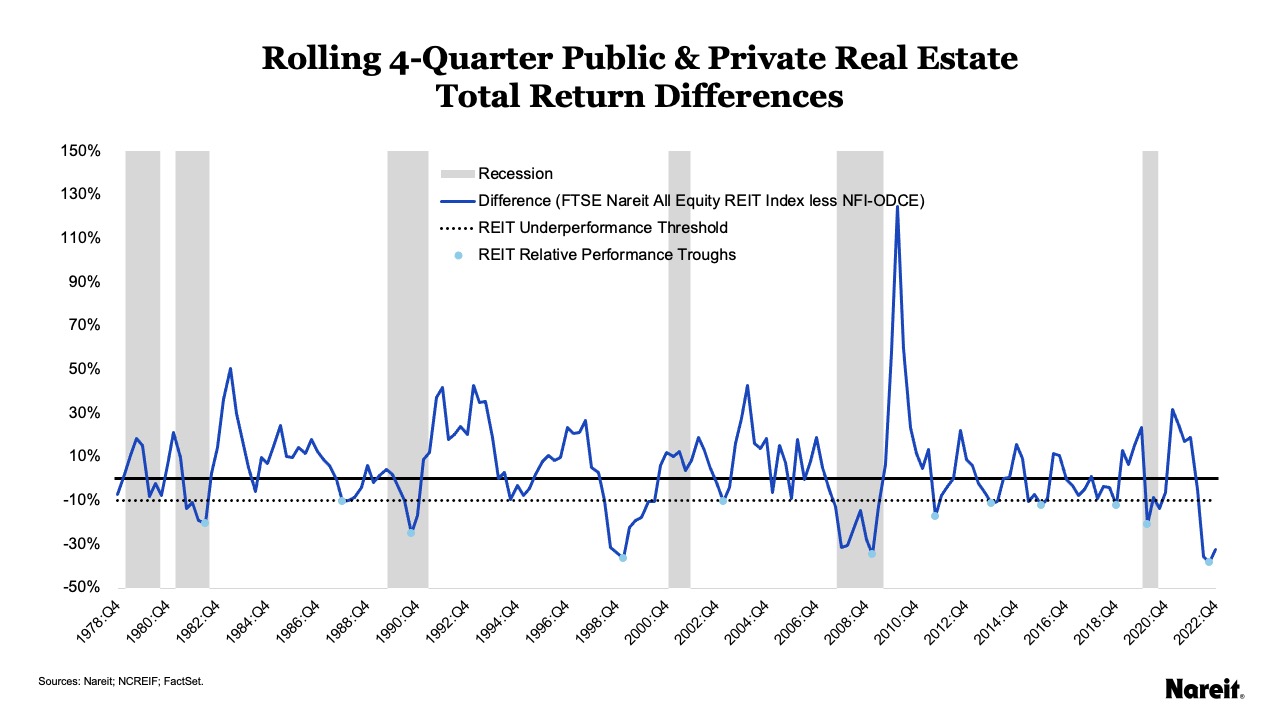
In the chart above, the FTSE Nareit All Equity Index and the NCREIF Fund Index–Open End Diversified Core Equity (NFI–ODCE) are utilized to measure REIT and private real estate market performances, respectively. It shows rolling four-quarter total return differences for public less private real estate (FTSE Nareit All Equity Index less NFI–ODCE), REIT relative performance troughs, and periods of U.S. recessions from the fourth quarter of 1978 to the fourth quarter of 2022.
The simple difference of total returns can act as a signal of divergence in the public and private property markets. Negative values highlight periods of REIT underperformance relative to private real estate; positive values indicate times of REIT outperformance. The 12 REIT troughs denote quarters that experienced significant REIT relative underperformance. Each nadir was more negative than an established threshold of -10%. For periods of consecutive negative total return differences, the minimum value was selected as the trough. Interestingly, only four troughs coincided with U.S. recessionary periods.
The chart reveals a pattern where public-private total return differences tended to significantly rebound after the identified troughs. Following the local minimum in the first quarter of 2009, REIT total returns surged by 106.7% in the next year. The most significant degree of REIT relative underperformance in the history of the indices occurred in the third quarter of 2022. Although data from the fourth quarter of 2022 showed an initial uptick, the degree and duration of the current divergence remains uncertain.
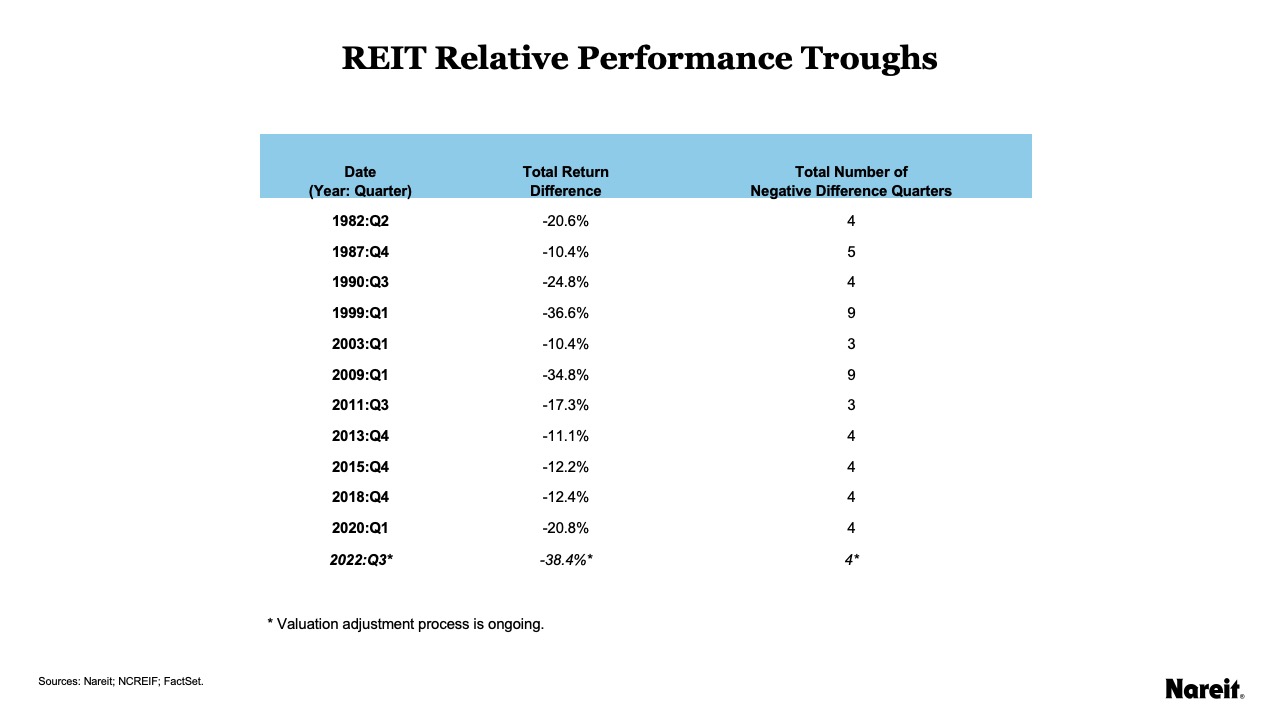
The table above presents the dates and rolling four-quarter total return differences for each of the 12 identified REIT relative performance troughs. It also displays the total consecutive number of negative difference quarters associated with each trough, which includes pre-trough, trough, and post-trough quarters. The magnitude of the trough total return difference indicates the degree of REIT relative underperformance during that quarter. The total number of negative quarters highlights the duration of REIT relative underperformance, or period of REIT dislocation. Eleven dislocations have been fully realized; the current (third quarter of 2022) dislocation remains a work-in-progress.
Focusing on the fully realized REIT dislocations, the number of pre-trough and post-trough negative quarters ranged from 0 to 7 and 0 to 5 quarters, respectively. No pattern was evident that troughs typically occurred in the beginning, middle, or end of the dislocations. For the troughs where the total return difference ranged from -10% to -25%, the average duration of REIT relative underperformance was 4 quarters. Two troughs experienced more significant degrees of REIT relative underperformance. They occurred in the first quarter of 1999 and first quarter of 2009 with total return differentials of -36.6% and -34.8%, respectively. For these more severe troughs, the period of REIT dislocation averaged 9 quarters.
The total return difference for the third quarter of 2022 trough was -38.4%. Fourth quarter data show that a move toward REIT recovery may have already started; the difference was -32.4%. As of the end of 2022, four quarters had passed during this current uncoupling. In 2023, the REIT relative underperformance gap is expected to close, most likely through changes in both REIT and private market valuations. If this comes to fruition, the period of REIT relative underperformance would be 8 quarters; a result that is consistent with past experiences for more severe troughs.

The chart above shows the average total returns for public and private real estate for the four quarters before and after REIT relative performance troughs for the 11 fully realized REIT dislocations. The current (third quarter of 2022) trough was excluded from the analysis as its valuation adjustment process is ongoing; it also lacked sufficient data for the post-trough calculations.
Not surprisingly, REITs, on average, underperformed private real estate in the four quarters prior to a trough. Average total returns for the FTSE Nareit All Equity Index and NFI–ODCE were 2.7% and 9.4%, respectively. These pre-trough results are a reminder that REIT relative underperformance does not have to mean negative REIT total returns.
On average, REITs outperformed private real estate in the four quarters after a trough. The post-trough analysis shows that:
- The REIT four-quarter total return averaged 36.4%; it was 5.1% for private real estate.
- The average REIT outperformance total return spread was 31.3%.
- REITs outperformed private real estate in nine of 11 instances, or 81.8% of the time.
These troughs can be harbingers of REIT total return outperformance.
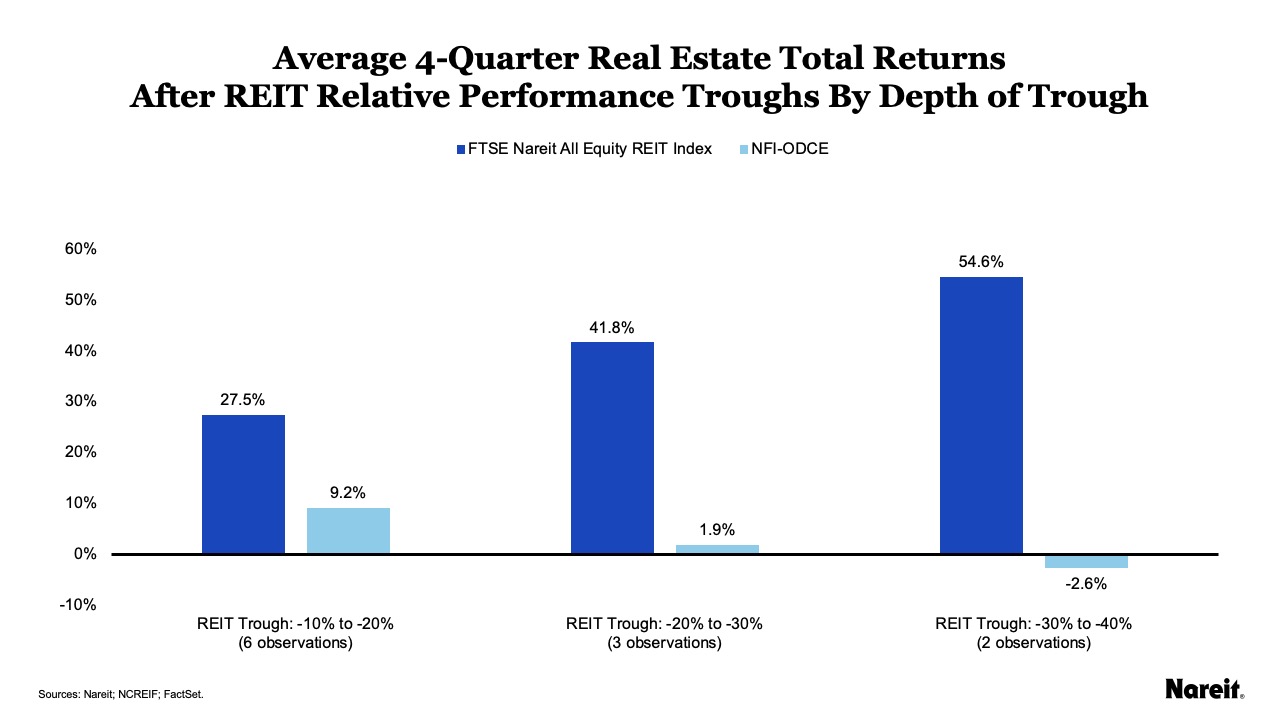
The chart above illustrates the average four-quarter total returns for public and private real estate after REIT relative performance troughs by the depth of the trough. Troughs were placed into three groups where the rolling four-quarter total return differences ranged from -10% to -20%, -20% to -30%, and -30% to -40%.
The average outperformance of REITs relative to private equity real estate is evident across all three cohorts. In reviewing the chart, some patterns become apparent. As the depth of the trough deepened (or the difference became more negative), the average next four-quarter REIT total returns increased markedly. Average REIT total returns for the most shallow, middle, and deepest trough groupings were 27.5%, 41.8%, and 54.6%, respectively. At the same time, average private real estate total returns decreased. The average NFI–ODCE total return turned negative in the most severe trough cohort (-30% to -40%); it was -2.6%.
This dichotomy of rising REIT and falling private real estate returns has resulted in a relationship where the average total return spread between public and private real estate (FTSE Nareit All Equity Index less NFI–ODCE) increased as the REIT relative performance trough became deeper. The most shallow trough grouping (-10% to -20%) had the lowest average total return spread; it averaged 18.3%. The total return spread for the middle group (-20% to -30%) was 39.9%. The spread for the deepest trough grouping (-30% to -40%) averaged 57.2%.
The divergence of public and private real estate markets in 2022 has created an interesting property investment environment. Investors are worried about the degree and duration of this uncoupling. While past performance may not be indicative of future results, a review of historical public and private real estate market divergences shows that performance troughs related to significant public-private dislocations can be a harbinger of REIT total return outperformance. Specifically, analysis shows that:
- REIT returns have tended to bounce back—and even surge—after significant public and private real estate market divergences.
- On average, REITs outperformed private real estate in the next four quarters after a REIT relative performance trough.
- The average REIT outperformance total return spread was 31.3%.
- REITs outperformed private real estate in nine of 11 instances, or 81.8% of the time.
- REIT recoveries have tended to be stronger with more extreme divergences.
Current market conditions have increased the attractiveness of REITs. With their strong operational performance and solid balance sheets, they are well-positioned to navigate the economic and market uncertainty of 2023.