The decision by S&P and MSCI last year to create a brand-new sector for Real Estate under their Global Investment Classification Standard (GICS) should further de-couple equity REITs from non-REIT stocks and help investors take better advantage of the diversification benefits of the real estate asset class. The massive 2017 tech-stock boom may have obscured it, but that’s exactly what seems to have happened: listed equity REITs have performed far differently—and far better—than the non-REIT stocks that have long been most similar to them.
REITs are generally considered to be “value-oriented companies” partly because the earnings produced by real property assets are comparatively easy to predict. (That contrasts with so-called “growth companies,” whose stock prices have often turned out to have been based on overly-optimistic predictions—think “irrational exuberance”—about the success of some new product under development.) REITs are also generally smaller companies: even the largest REIT, American Tower, is only about one-fourteenth the size of Apple. In that sense REITs are small-cap value companies, and therefore have been grouped with other (non-REIT) small-cap value companies.
The fact that investing in REITs means investing in the real estate asset class rather than the business cycle that drives the rest of the stock market means REITs have always had a low correlation with non-REIT stocks in general; still, it’s true that returns on REITs have typically been more similar to those on small-cap value companies than other segments of the stock market. Over the past 25 years, for example, the correlation between listed equity REITs and small-cap value stocks has averaged just 72%, but that’s higher than REITs’ correlations of 63% with large-cap value stocks, 50% with small-cap growth stocks, and 45% with large-cap growth stocks. (I used monthly total returns for the FTSE NAREIT All Equity REIT Index and the Russell 2000 Value, Russell 1000 Value, Russell 2000 Growth, and Russell 1000 Growth indices, respectively.)
A key attribute of small-cap value companies is that over long investment periods their investment returns have simply whipped those of large-cap growth companies: according to data published by Kenneth French of the famous Fama-French team of stock market researchers, returns of small-cap value companies (on an equal-weighted basis) have exceeded those of large-cap growth companies by 18.71% vs 9.46% per year for the past 91 years!
Here’s something that may surprise you, though: listed equity REITs have generally outperformed small-cap value stocks, posting slightly higher returns but substantially lower volatility and substantially better diversification benefits.
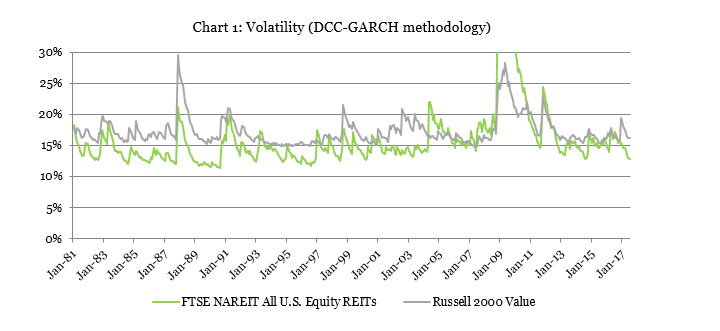
Over the past 25 years total returns for listed equity REITs were only slightly stronger than for small-cap value stocks at 11.1% per year vs 11.0% per year (again using the Russell 2000 Value Index), but listed equity REITs almost always showed less volatility and better diversification benefits. Chart 1 compares the volatility of monthly total returns for listed equity REITs (green) and small-cap value stocks (grey). REIT volatility has usually ranged between 13.5% and 16.6% and has almost always been less than small-cap value stock volatility, which has usually ranged between 15.9% and 17.9%. (Why REIT volatility spiked so much higher than small-cap value stock volatility during the 2008-09 liquidity crisis still isn’t clear.)
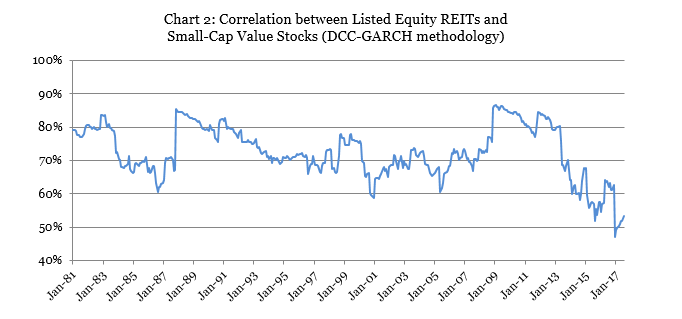
Chart 2 shows that the correlation between them has usually been between 68% and 79%, and has never touched even as high as 87%, even during the worst market crises.
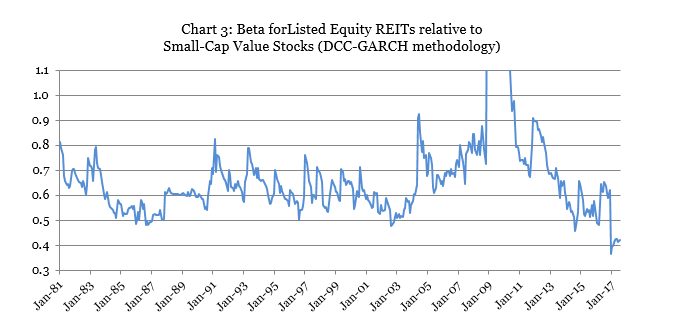
Beta measures whether adding a new asset to an existing holding will reduce portfolio volatility (beta<1) or exacerbate it (beta>1). Chart 3 shows that adding listed equity REITs to an existing holding of small-cap value stocks has almost always had the effect of reducing portfolio risk, with beta usually in the range of 0.57 to 0.70. (Again, the 2008-09 liquidity crisis was the still-unexplained exception.)
Finally, alpha measures risk-adjusted returns: that is, whether the new asset adds to portfolio returns without increasing portfolio risk. Alpha for listed equity REITs relative to small-cap value stocks has averaged +0.30% per month (+3.66% per year) over the entire period shown in the charts, and an even greater +0.34% per month (+4.13% per year) over the past 25 years. In short, adding listed equity REITs would have improved the risk-adjusted performance even of a portfolio focused on what is generally the best-performing segment of the non-REIT stock market.
The long-term outperformance by REITs relative to small-cap value stocks has been even more pronounced than usual during the first seven months of 2017. In a previous Market Commentary I noted that the stock market rally this year has been concentrated mainly in large-cap stocks that were already expensive relative to their actual earnings—companies like Amazon, Facebook, and Google—while small-cap value companies posted an anemic total return of just +1.18% through July. Listed equity REITs, though, avoided the malaise that affected non-REIT small-cap value companies, with returns averaging a healthy +6.17%. (By the way, mortgage REITs performed even better with total returns of +16.48%—almost as strong as the tech behemoths—but mortgage REITs are not included in the new GICS Real Estate sector.)
At the same time, REIT volatility has been extraordinarily low (12.8% for July) while small-cap value stock volatility has been only slightly below normal (16.2% for July). The correlation between them reached its all-time low at the end of 2016 and has remained almost as low since then (53% for July), while beta for listed equity REITs relative to small-cap value stocks is also up only slightly (0.42 for July) from the all-time low it reached at the end of 2016.
In short, listed equity REITs have always tended to be a welcome addition to a stock portfolio even for those investors who knew the Fama-French secret of investing primarily in small-cap value stocks—but they were never as welcome as they have been in 2017 when the non-REIT small-cap value segment lagged so far behind the rest of the stock market.
Note: the empirical methodology I used to evaluate how volatilities and correlations have changed over time is call dynamic conditional correlation with generalized autoregressive conditional heteroskedasticity (DCC-GARCH). It is considered pretty much the state of the art for such purposes, and is substantially more accurate than several methods that are still commonly used such as rolling standard deviations and rolling correlations.
If you have any comments or questions, or want to see more results from my DCC-GARCH analysis, drop me a note at bcase@nareit.com.


