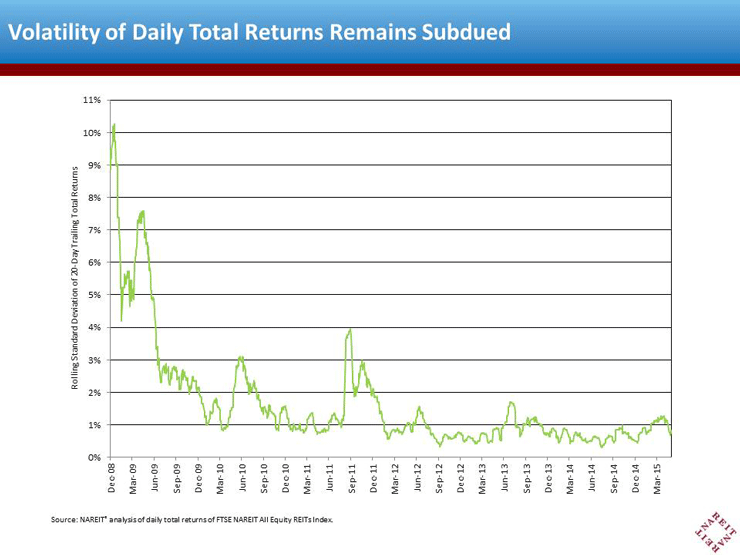
While some market participants raised concerns about market volatility during March and April, the listed REIT market remained relatively calm. As the market closed on May 5, the 20-day rolling standard deviation of trailing daily returns for the FTSE NAREIT All Equity REITs Index was 0.82%, slightly below the median value going all the way back to the beginning of 1999. That measure of volatility hit a high of 10.27% in December 2008 (the liquidity crisis); the highest point after the liquidity crisis was in April 2009 (the start of the recovery), when it hit 7.58%; the highest point after that was August 2011 (European debt crisis), when it hit 3.95%; the highest point after that was in June 2013 (taper tantrum), when it hit 1.70%; and its maximum value since the beginning of March 2015 was 1.3%.
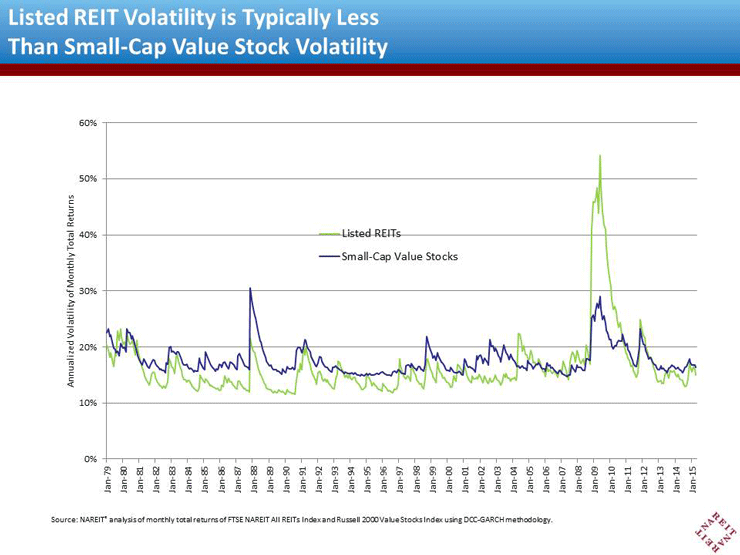
However, a better way of measuring volatility is using the GARCH model pioneered by Nobel prize-winning economist Robert Engle. My GARCH model based on monthly data suggests that the annualized volatility as of the end of April 2015 was 15.05% and has been moving steadily downward since November 2014. Volatility for listed REITs is typically slightly lower than for small-cap value stocks, and that was true again at the end of April, with small-cap value stock volatility at 16.36%.
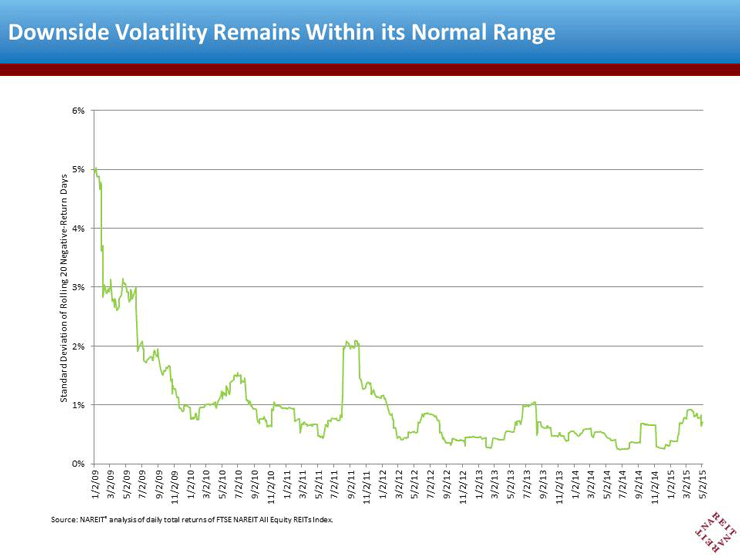
Of course, April was a down month for the listed REIT market, with the total return on the FTSE NAREIT All REITs Index down 4.71%. Many investors focus only on volatility in the negative direction, and one way to measure this is by the standard deviation of total returns during the 20 trailing days of negative returns. By this measure, downside volatility after May 5 was 0.71%, slightly higher than the long-term median but, again, far lower than the peaks during the 2008/09 liquidity crisis or the European debt crisis.
While unforeseen events may increase market volatility in the future as, for example, the European debt crisis did in the past, investors in listed REITs have continued to enjoy relatively low volatility for most of the time since the 2008/09 liquidity crisis ended.