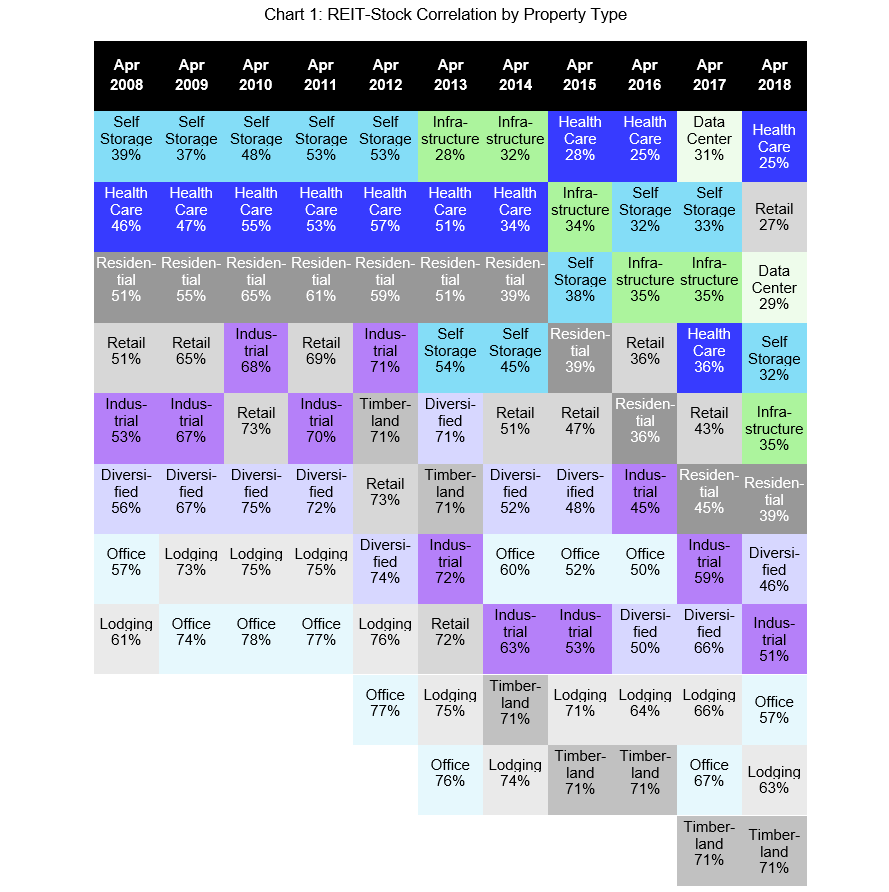
I’ve published two recent market commentaries analyzing property-type sectors of the U.S. REIT market, the first focused on beta relative to the broad stock market and the second focused on average total returns . In this commentary I thought I would continue analyzing the diversification benefits of different segments of the REIT market, this time focusing on the correlation between each sector and the broad stock market. As we saw with beta, historical correlations suggest that some REIT segments are more procyclical, tending to do well when the broad stock is also doing well, while others are more countercyclical, tending to do well when stock market returns are disappointing.
Chart 1 shows the correlation in total returns between each sector of the REIT market and the broad stock market for every 12-month period starting May 2007 and ending April 2018. (Technical note: these are computed from a DCC-GARCH model using monthly data from January 1994 through April 2018, and show the average correlation estimated during each 12-month period. The broad stock market is measured using the Russell 3000 Index.)
One thing that’s worth noting right away is that the old adage, “correlations spike to one during a crisis,” is absolutely false: during the 12 months ending April 2009, for example, the highest average correlation between any REIT sector and the broad stock market was 74 percent. In fact, the highest correlations between REITs and non-REIT stocks came several years after the crisis, around 2011, when the broad stock market finally started to match the strong recovery that had started in 2009 among REITs. (Even then, REIT-stock correlations never exceeded 81 percent even for individual months.)
The property types that have generally shown the lowest historical correlations with the broad stock market include Health Care, Self Storage, Residential, Infrastructure, and Data Centers: the REIT-stock correlation for Health Care REITs never exceeded 57 percent on average during any of the 12-month periods shown, Self Storage and Residential never exceeded 53 percent or 65 percent respectively, Infrastructure never exceeded 35 percent during the six available years, and Data Centers didn’t exceed 31 percent during either of the two available years. Those five sectors were the ones most easily identified as “defensive” sectors in my previous market commentary on beta by property type.
Perhaps more important, correlations have not been very high even for the property type sectors that generally had the highest correlations to the broad stock market. The Office sector, for example, showed the highest average correlations during five of the 11 years shown—but the correlation between Office REITs and the broad stock market never got above 78 percent on average, even during the 12-month period that included the Great Financial Crisis. Similarly, my earlier market commentary identified the Lodging & Resorts sector as perhaps the most procyclical segment of the REIT industry—but the REIT-stock correlation for Lodging REITs never got above 76 percent. Timberland REITs have shown the highest average correlations during each of the four most recent periods, but never greater than 71 percent.
The Retail, Industrial, and Diversified sectors have generally been in the middle of the REIT pack in terms of their correlations with the broad stock market. Again, though, they have tended to show reasonably low REIT-stock correlations: the average across the reported 12-month periods has ranged from 27 percent to 73 percent for Retail, from 53 percent to 72 percent for Industrial, and from 46 percent to 75 percent for Diversified.
Keep in mind that a low correlation is not enough to generate a diversification benefit: hiding cash under a mattress, for example, does not diversify your portfolio even though the correlation between stashed cash and the returns on any other asset is zero. Diversification benefits arise from a combination of low enough correlations with high enough risk-adjusted returns. In an upcoming market commentary I expect to review the historical evidence on the risk-adjusted returns of REITs by property sector.
I generally update these estimates every month, so if you want updated figures—or if you have any other questions or comments—please drop me a note at bcase@nareit.com.
