Homeownership is recovering. After years of decline during the housing crisis and its aftermath, the homeownership rate has been on a steady uptrend for the past few years. Indeed, by mid-2018 homeownership had nearly returned to the average rate experienced during the period from 1980 through 2000, before the run-up that preceded the housing crisis.
This recovery in housing markets is undoubtedly good news for the country overall, but has generated concerns among investors in apartment properties that a rebound in homeownership could undermine the demand for apartments. Nothing could be further from the truth! Demand for apartments remains robust, and the swing in ownership rates comes at the expense of another segment of the housing market, namely, single family home rentals (SFR). The SFR market expanded dramatically as millions of American households who fell into financial distress during the financial crisis a decade ago were unable to afford homeownership, but the number of SFR fell by more than 300,000 last year. The recent reversal sends a strong signal of improvements in household finances that are likely to support not just housing markets but also the macroeconomy for the foreseeable future.
The decline in the overall number of SFR does not, however, represent sales by REITs. The SFR REIT sector dominates the institutional portion of the home-rental business, as these companies enjoy economics of scale in managing large portfolios of rental homes and in raising capital to invest in rental properties. In addition, the SFR REITs bring professional management and a national platform to the home rental market that otherwise consists of fragmented local operators, many of whom do not employ professional management or maintain high standards for customer service (see Single Family Rental REITs: Long-term Players Providing Additional Housing Options for more information about the SFR REITs).
REITs have not been net sellers of rental homes, with total holdings of the sector stable at 150,000 or more rental homes. There is solid demand for the professional management of home rentals that REITs provide, and they are likely to maintain or even expand their holdings. The sales of SFR are most likely by the small investors—individuals, “mom & pop” investors and partnerships—that own the majority of homes in the SFR market. These small investors bought distressed properties in their towns and neighborhoods during the housing crisis, and many are now looking to cash out.
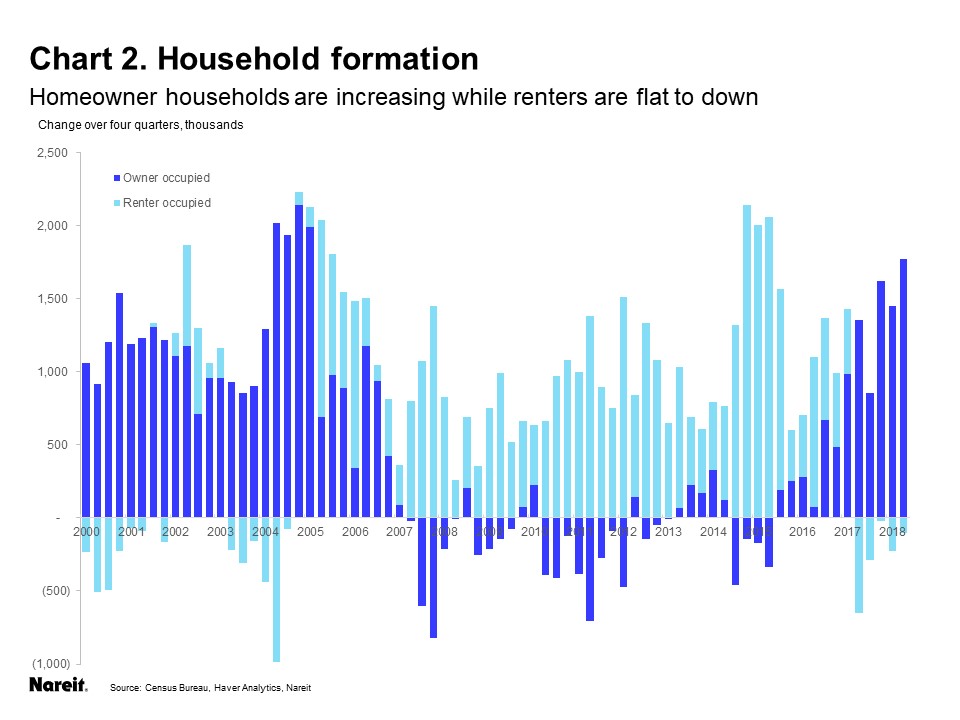
We can get a clearer picture of the forces driving the rebound in homeownership rates by examining trends in total owner-occupied and rental households. Over most of the past 50 years, homeowners accounted for the majority of household growth. During the housing crisis, however, the number of owner-occupied homes fell, and from 2007 through 2015, renters accounted for all of the increases in U.S. housing (light blue bars in above chart). The past three years have seen a return to the more typical historical pattern of rising homeowner households, while rental households have declined.
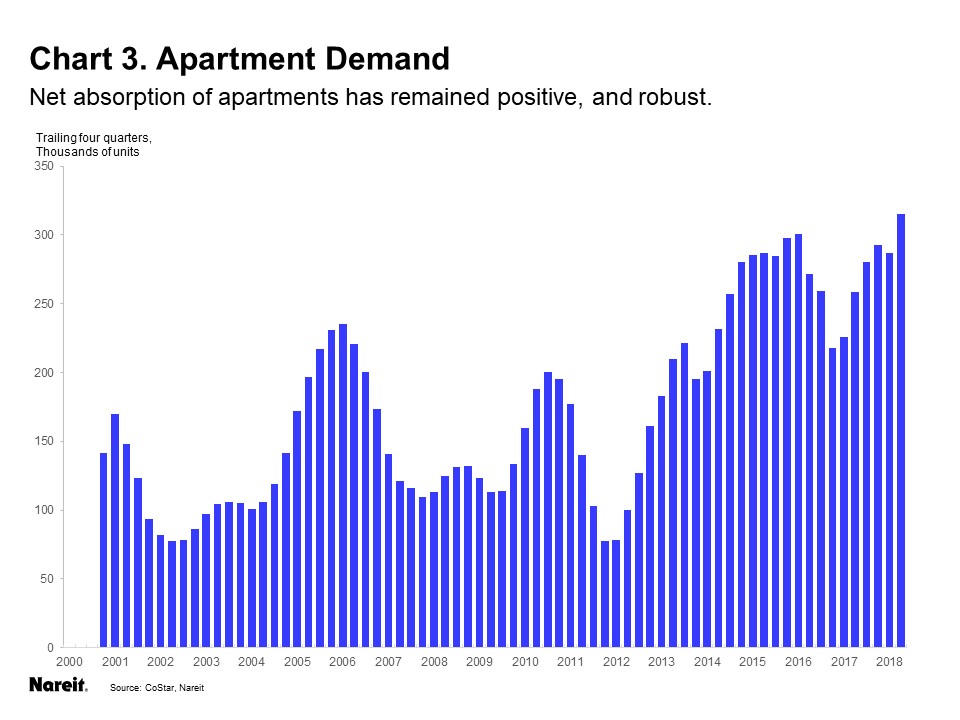
The decrease in rental households has not, however, been accompanied by a decline in demand for apartments. In fact, net absorption (that is, the increase in occupied apartment units) rose to a record high in the four quarters through 2018:Q2, according to data from CoStar. How can the decline in the number of rental households be reconciled with rising demand for apartments?
The key to this puzzle is to remember that not all renters are in apartments. In fact, over one-third of all renters last year were renting a single family home. The number of SFR rose sharply during the housing crisis because several million households that wanted to live in a single family home, often because their family size required more bedrooms or they wanted to live near suburban schools, suddenly became unable or unwilling to own their own home. (For more detail on the rise of the single family rental business, see Single Family Rentals: Demographic, Structural and Financial Forces Driving the New Business Model.)
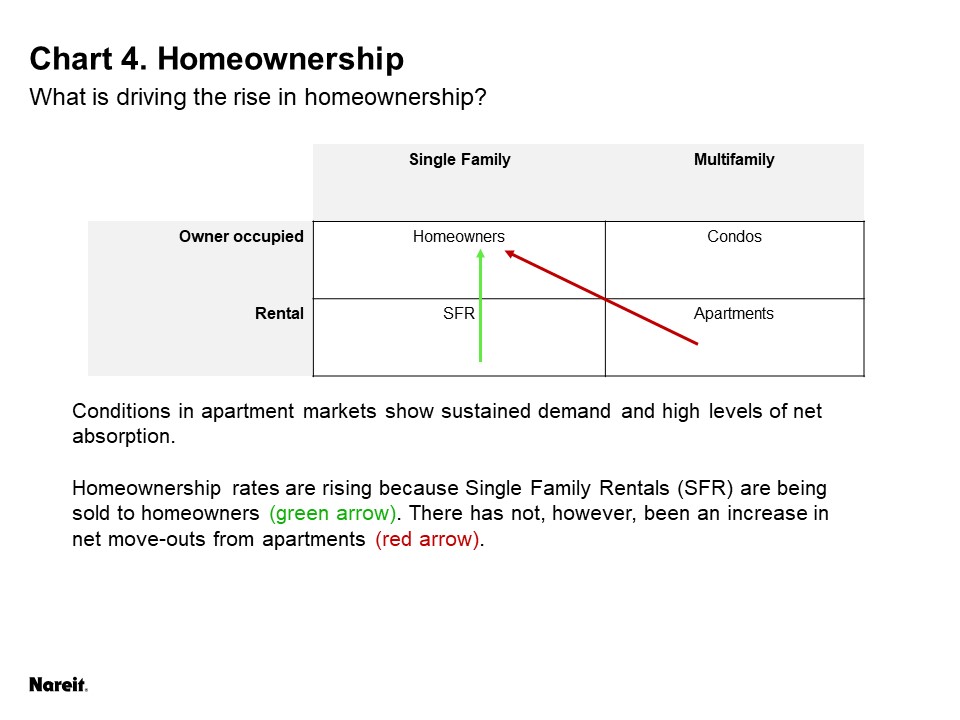
The rise in homeownership since 2016 has been driven by single family homes that during the crisis had been converted to rental properties and are now being sold to new homeowners. This is a reversal of the trend during the crisis, when homes (often in foreclosure) were converted to rentals. This shift in ownership patterns within the single-family sector does not have any implications for demand for apartments. This can be seen in chart 4, which shows the four basic housing options, owner vs rental and single-family vs multifamily, in a two column, two row table. The recent increase in homeownership is represented by the green arrow of rental homes being sold to new homeowners. The red arrow, indicating move-outs from apartments into homeownership, would weaken demand for apartments—but such move-outs have not, on net, been large and are not responsible for the recent rise in homeownership.
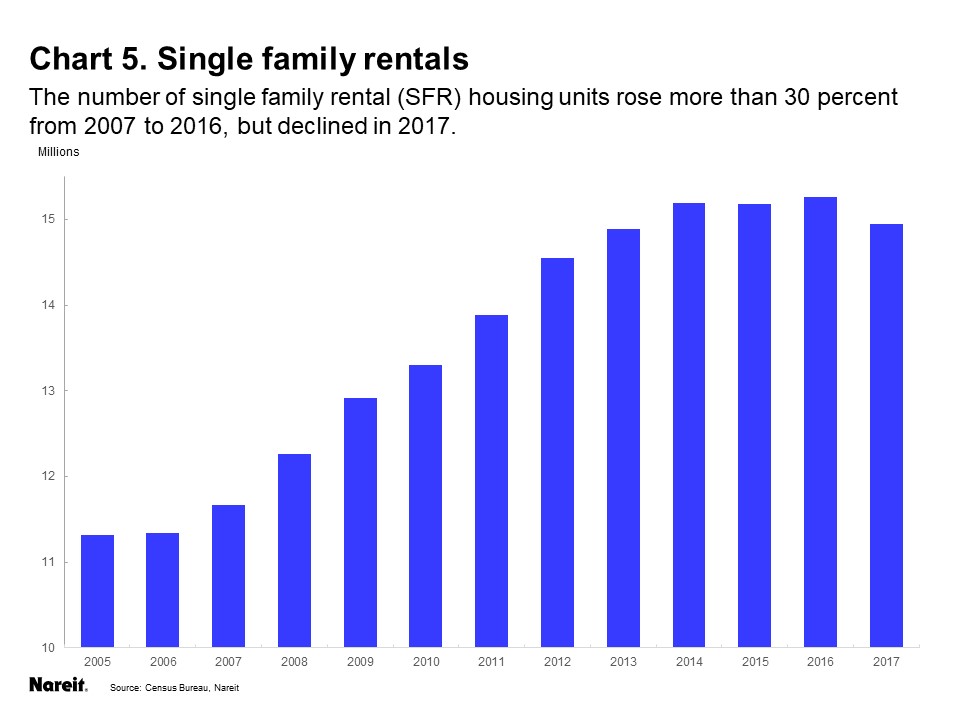
The reversal of the rise in SFR reflects improvements in the underlying financial position of U.S. households. As household finances deteriorated rapidly during the crisis, there was a net increase in SFR of one-half million or more homes nearly every year from 2008 through 2012, with further annual increases of one-quarter million or more through 2014 . As the economy gained strength and jobs and incomes rose, however, increases in SFR tapered out in 2015-2016, and the total number of SFR peaked at 15.3 million in 2016, an increase of more than 30 percent since the onset of the financial crisis.
The Census Bureau recently released statistics from the American Community Survey (ACS) for 2017, which showed a decline of more than 300,000 SFR as the shift back towards homeownership accelerated. These statistics, however, are already a full year out of date. While the ACS is the most accurate source of information on overall trends in single-family rentals and single-family homeownership, the data are published after a lag of more than one year. The quarterly information on homeownership rate and the growth of owner and rental households, on the other hand, is from the Housing Vacancy Survey (HVS) that is published one month after the end of the quarter. [1] We can make use of the more-current HVS data to get a good idea of what has happened in the SFR market more recently. [2]
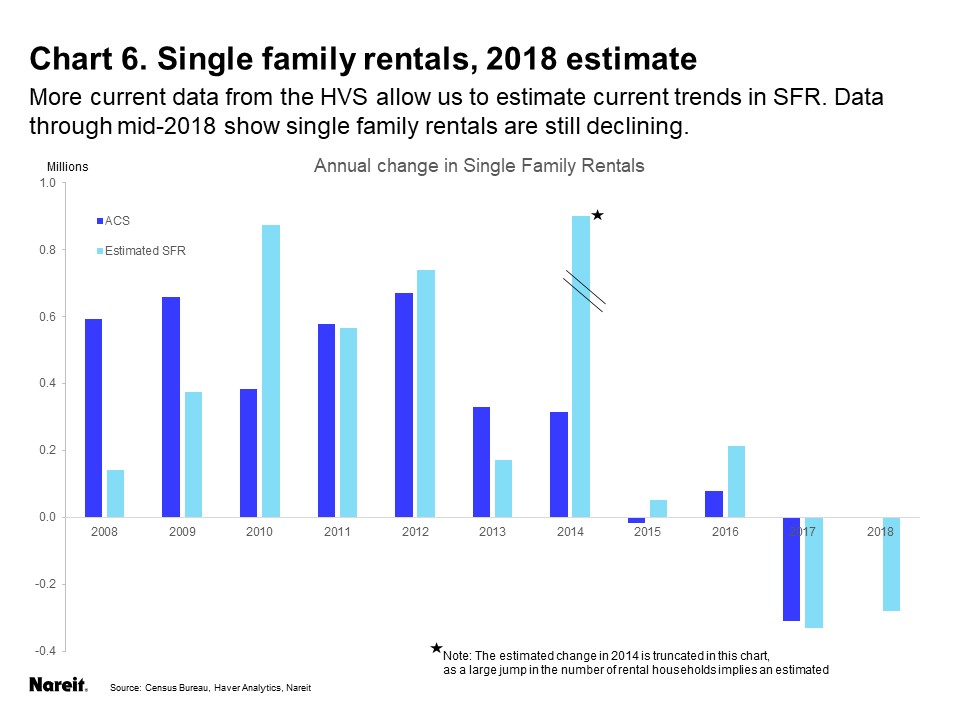
Chart 6 plots the annual change in SFR reported in the ACS along with an estimated change based on the quarterly HVS. For most of the past decade, the estimates are reasonably close, although there was a large difference in the 2014 estimate. One should take the point estimates of annual changes in SFR from either of these measures with a large grain of salt, but on balance they both show similar direction and magnitude of changes in the market. Indeed, the estimate derived from the HVS conformed closely to the actual results for 2017 from the ACS.
Estimates based on the HVS indicate that SFR continue to decline in 2018. This suggests that large numbers of U.S. households are becoming homeowners, either as first-time homebuyers or are returning to homeownership after a period of renting following the financial crisis, and many are buying single family homes that had previously been operated as rental properties. This implies that household finances and confidence continue to improve. Indeed, the Federal Reserve recently published the Financial Accounts of the United States for 2018:Q2, which showed aggregate household net worth rose $8.1 trillion over the past four quarters, to $106.9 trillion, an increase of 85 percent from its low point in 2009. Consumers are the mainstay of the U.S. economy, and this improvement in household finances is an indication that the macroeconomic recovery maintains momentum.
The recent news on homeownership and apartment demand is favorable for many reasons. Hundreds of thousands of households are becoming homeowners, in part because of improvements in their financial position. Apartment demand remains strong, however, reflecting pent-up demand that built up during the crisis. And robust demand for both homeownership and apartment rental represents solid momentum for the overall economy.
[1] The ACS is based on a survey sent to 295,000 addresses each month, or a total of 3.5 million households surveyed each year. Since the survey continues throughout the 12 months of the year, the annual figures represent a mid-year average. The source of the quarterly data on homeownership rates and overall growth of owner and rental households is the Housing Vacancy Survey (HVS), which surveys some 72,000 housing units. The HVS is available on a quarterly basis with a lag of roughly one month from the end of the quarter.
[2] Indeed, I used the HVS data last spring to predict the decline in SFR that was reported this month in the ACS. See, Developments in Single-family Rental Housing, presentation to the Housing Statistics Users Group, Washington, DC, May 4, 2018. Slides available on request.