I’ve published three recent market commentaries analyzing property-type sectors of the U.S. REIT market: one on beta relative to the broad stock market , a second on average total returns , and a third on REIT-stock correlations . In this commentary I thought I would continue analyzing the diversification benefits of different segments of the REIT market, this time focusing on risk-adjusted returns over the past 11 years. I’ve never excluded any segment of the REIT market from my own investment portfolio, and I think the data shown in these four market commentaries show why.
Chart 1 shows the Sharpe ratio for each property-type sector for 12-month periods starting May 2007 and ending April 2018. The Sharpe ratio is defined as average excess total returns over each period (meaning simple average total returns minus the average return on a risk-free asset) divided by return volatility. For liquid, institutional-quality assets such as REITs and non-REIT stocks, you can think of the Sharpe ratio as a measure of returns per unit of risk. (It’s very important not to use the Sharpe ratio, however, for assets such as private equity or private real estate where there are significant risks other than volatility, such as illiquidity, and/or where volatility is not measured correctly.)
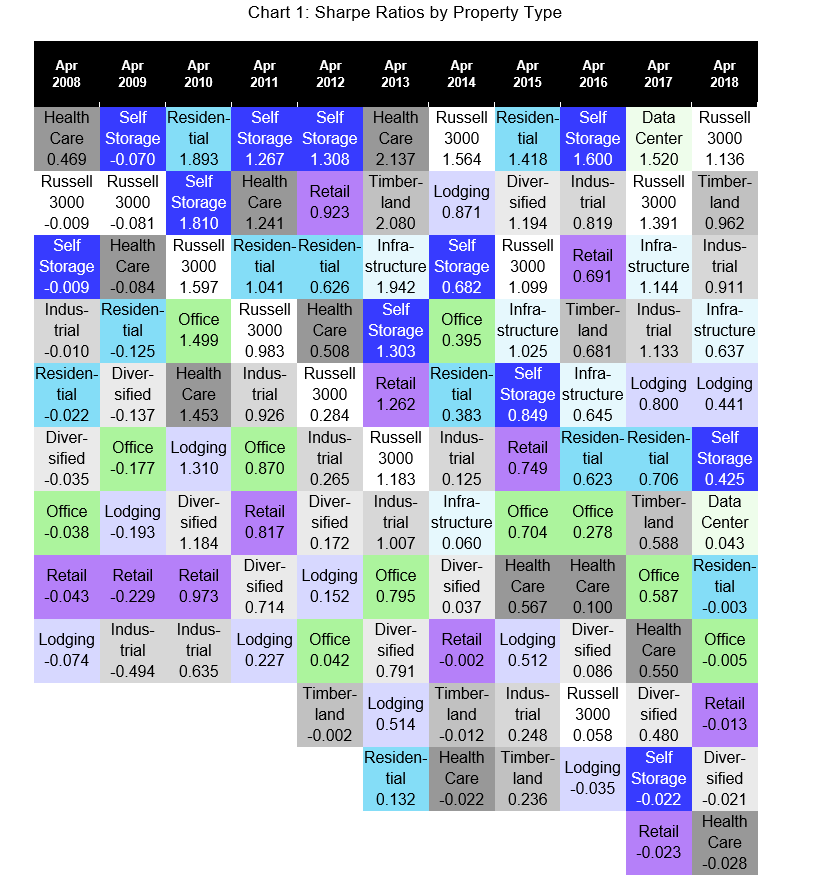
The Sharpe ratio for the Russell 3000 is included in Chart 1 as a benchmark, but that bears some careful explanation. The Russell 3000 measures the returns for the broad stock market, but the broad stock market is actually a diversified portfolio of equity assets including (1) stocks whose returns are driven by the real estate market cycle—that is, REITs; (2) stocks whose returns are driven by the commodities market cycle—that is, energy stocks and materials stocks; and (3) stocks whose returns are driven by the business cycle—that is, almost everything else. Those three market cycles are quite different from each other—for example, the duration of the real estate market cycle, which is determined largely by construction activity (the supply side of the real estate market), seems to average around 18 years whereas the duration of the business cycle, which is driven by macroeconomic demand conditions, seems to average something much closer to four years. Because segments of the stock market have such disparate return drivers, the volatility of the broad stock market is comparatively low, reflecting the diversification benefit across parts of the stock market. (There’s a similar diversification benefit across parts of the REIT market, which we’ll consider later.) When we look at property-type sectors within the REIT market, however, we’ve stripped away the volatility-reducing effects of diversifying your holdings across property types, much less the volatility-reducing effects of diversifying across market cycles.
In short, it’s difficult for any segment as homogeneous as REITs in a given property type to match the risk-adjusted returns of something as diverse as the broad stock market. It’s striking, then, that nearly every segment of the REIT market has spent as least one 12-month period outperforming the broad U.S. stock market by posting a higher Sharpe ratio. Self Storage REITs, for example, outperformed even a broadly diversified U.S. stock portfolio during six of the 12-month periods shown: those ending in 2009, 2010, 2011, 2012, 2013, and 2016. Similarly, Residential REITs outperformed a broadly diversified stock portfolio five times during the periods ending in 2010, 2011, 2012, 2015, and 2016, while Health Care REITs outperformed a broadly diversified stock portfolio also five times during the periods ending in 2008, 2011, 2012, 2013, and 2016.
The most important use of the Sharpe ratio is to identify whether adding a new asset to your existing portfolio will bring diversification benefits. Diversification benefits come when the Sharpe ratio of the new asset is greater than the Sharpe ratio of the existing portfolio multiplied by the correlation between the new asset and the existing portfolio:
![]()
Combining the Sharpe ratios shown in Chart 1 with the correlations shown in my market commentary on REIT-stock correlations suggests, for example, that an investor whose existing portfolio matched the Russell 3000 would almost always have earned better risk-adjusted returns by devoting a separate allocation to REITs, even during most of the years when the broad stock market produced flashier numbers. For example, many observers have noted that the broad stock market outpaced the REIT market over the past 12 months, but stock market investors could have increased their portfolio risk-adjusted returns by also investing in Timberland, Industrial, Infrastructure or even Self Storage REITs: even though their Sharpe ratios (0.962, 0.911, 0.637, and 0.425 respectively) were more moderate than those of the Russell 3000 (1.136), low correlations—71 percent, 51 percent, 35 percent, and 32 percent respectively—would have improved the risk-adjusted performance of the combined portfolio.
In fact, there’s not a single segment of the REIT industry that wouldn’t have improved the Sharpe ratio of a Russell 3000 portfolio during at least one of the 12-month periods shown, and several of them—Infrastructure, Health Care, Self Storage, Residential, and Industrial—would have improved portfolio risk-adjusted performance more often than not.
Of course, one great attribute of the REIT market is that the property-type sectors differ markedly from each other even though they all respond to the real estate market cycle: that is, the real estate asset class offers internal diversification opportunities as well as asset-class diversification opportunities relative to stocks, bonds, commodities, and other asset classes. For example, Retail REITs by themselves have shown a disappointing Sharpe ratio of -0.013 over the past 12 months—but the correlation between Retail REITs and Lodging REITs was just 62 percent as of the end of April 2018, meaning that investors with holdings in both sectors would see lower volatility in their combined REIT portfolio, and therefore higher risk-adjusted returns, which in turn would help to provide diversification benefits relative to their non-REIT holdings.
That’s why, as I mentioned, I’ve never excluded any sector of the REIT market from my own investment portfolio. Graph 1 has taught me that each sector has the potential to contribute diversification benefits through both strong risk-adjusted returns and low correlations—and sometimes it’s the interaction between two sectors that benefits my portfolio rather than the stand-alone attributes of each property type individually. For those investors and investment managers who seek to tailor their portfolios more specifically, however, I hope these analyses will be helpful.
I generally update these estimates every month, so if you want updated figures—or if you have any other questions or comments—please drop me a note at bcase@nareit.com.