The investment world is full of shorthands—pithy statements that often take the place of thoughtful analysis. It’s unfortunate but true that those shorthands often lead investors to make just the wrong decisions. One of those damaging shorthands is the idea that correlations “spike to one” during a market crisis.
It’s true that we’ve generally seen correlations among equity assets increase during periods of market turmoil. That’s to be expected, for a simple reason: the discount rate that investors use to value all assets increases sharply during periods of turmoil, affecting all assets in the same way. But discount rates are only part of the equation—and “correlations increase” is very different from saying, as some have said, that “diversification fails when it is needed most.”
I’ve suggested in other market commentaries that the current market environment reminds me uncomfortably of the period just before the dot-com crash at the end of the 1990s , so this may be a good time to take a closer look at that popular shorthand about correlations.
Perhaps investors would be better off remembering another pithy statement that has the advantage of being true: “Asset class diversification pays off even during crises.” What makes REITs an essential component of every investment portfolio is the fact that their cash flow drivers come from a market cycle—the real estate market cycle—that is entirely different from the business cycle that drives most of the non-REIT parts of the stock market. The real estate market cycle has an average duration close to 18 years—primarily because of the very long time it takes to develop even a relatively simple income-producing property from the first permit applications until it reaches full occupancy—while the average duration of the business cycle is something much closer to four years. That dramatic difference in the underlying cycle driving cash flows is what is meant by asset class diversification.
Let’s use the available historical data to look at what has happened to correlations during past market crises. Graph 1 shows the correlation between REITs and the broad stock market (S&P 500) during stock market down months going back to the beginning of 1972. The first column shows that, during the 205 months when total returns for the broad stock market were negative, the REIT-stock correlation was just 56 percent. That almost exactly the same as the correlation computed from all months of data: 57 percent.
Keep in mind what the correlation means in terms of diversification benefits for your portfolio: if the correlation is 56 percent, then adding REITs to an existing stock portfolio would make you better off even if the risk-adjusted returns of REITs were only 56 percent as much as the risk-adjusted returns of stocks. Actually, though, REITs have provided risk-adjusted returns about six percent higher than stocks—so a correlation as low as 56 percent on top of higher risk-adjusted returns is a major bonus.
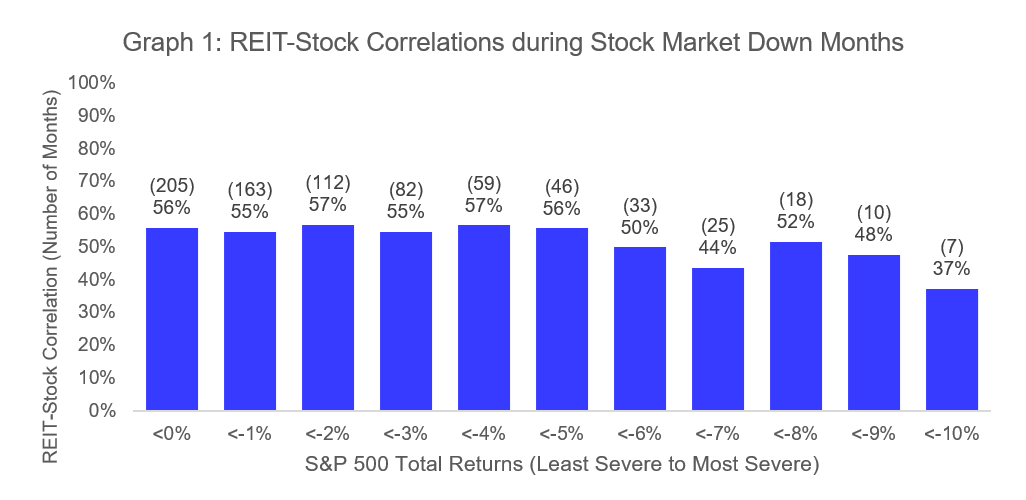
What’s most remarkable about Graph 1, though, is that the REIT-stock correlation has actually been lower during months when the stock market turned down even more severely. At the right edge of the chart we see that, during the seven worst stock market months since the beginning of 1972 (when REIT returns first became available) the REIT-stock correlation has been just 37 percent. Those months are hard to forget: October 1987 (S&P 500 total returns -21.52 percent), October 2008 (-16.79 percent), August 1998 (-14.46 percent), September 1974 (-11.70 percent), September 2002 (-10.87 percent), November 1973 (-10.82 percent), and February 2009 (-10.65 percent).
It’s not that REIT investors weren’t hurt during those months of market crisis—that would be too much to ask (unless we could make up the data!)—but REIT returns, on average, were slightly better than the S&P 500 with slightly less volatility. Again, a 37 percent correlation means that you would be better off adding REITs to your stock portfolio provided that the risk-adjusted returns from REITs would be no less than 37 percent as high as the risk-adjusted returns from your stock portfolio—yet REITs actually provided higher risk-adjusted returns, even during the worst seven individual months in the history of the S&P 500 back to the beginning of 1972.
Of course, many market crises are much shorter than a month—think, for example, of the “flash crash” of May 6, 2010—and it’s possible that monthly returns obscure the fabled “spike” in correlations during market crises. Guess again. Graph 2 is essentially the same as Graph 1, except that it’s based on daily returns rather than monthly returns (and goes back only as far as the beginning of 1990 because daily REIT returns were not available before then). The first column shows that, during the 3,304 days when total returns for the broad stock market were negative, the REIT-stock correlation was just 62 percent.
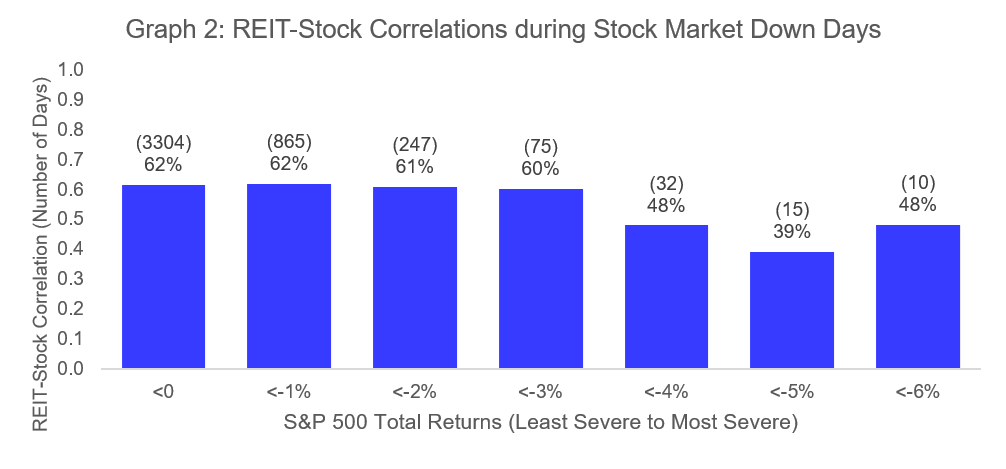
Much more remarkable, however, during the 10 worst days in the history of the S&P 500 back to the beginning of 1990, the REIT-stock correlation was actually lower at just 48 percent! Again, that doesn’t mean the REIT investors weren’t hurt: seven of those 10 days, after all, were during the initial days of the Great Financial Crisis (September-November 2008), when investors were concerned that REITs might not be able to refinance their mortgages. Still, a correlation of just 48 percent between two groups of equity assets is remarkably low during the 10 worst days in the market. It’s also a long, long way from “correlations spike to one.”
The diversification benefit from REITs comes not merely from the low correlation between REITs and other parts of your portfolio, including stocks: the diversification benefit comes also from the fact that REITs have provided stronger risk-adjusted returns than most other assets, including stocks. But the low correlations are an important part of the reason that REITs belong in literally every investment portfolio from the smallest retail account to the largest institutional pension fund. It’s because REITs have proved themselves through multiple market crises as the most efficient way for investors to access the real estate market cycle.
Asset class diversification pays off even during crises.
Details: REIT total returns are measured by the FTSE Nareit All Equity REIT Index. Daily returns for the FTSE Nareit All Equity REIT Index are available only since January 4, 1999, so prior to that date I used a composite constructed from the S&P US REIT, FTSE EPRA/Nareit USA, MSCI US REIT, Wilshire US REIT, and Dow Jones US Select REIT indices. This analysis was stimulated by the article “When Diversification Fails” by Sébastien Page and Robert A. Panariello, Financial Analysts Journal 74(3):19-32, 2018Q3. If you have any questions or comments, please drop me a note at bcase@nareit.com.