In two market commentaries I published near the beginning of this year I showed that simple valuation metrics such as the spread between average dividend yields for listed equity REITs and the yield on 10-year Treasury securities, or the average difference between listed equity REIT stock prices and the net asset value of their asset portfolios (P-NAV), have historically been quite dependable for predicting listed equity REIT total returns over the next several years.
Each of those valuation metrics builds on the idea of “buying” a given set of performance attributes for the best available price: the REIT dividend yield spread to Treasuries is the relative “price” for a steady stream of income, while the REIT price-to-NAV premium (or discount) is the relative “price” for total returns from essentially the same set of property assets available on the public and private sides of the real estate market.
REIT Dividend Yield Spread to Treasuries. Investors typically buy Treasury bonds for their steady income, but listed equity REITs have also been a source of steady income (along with some capital appreciation). If the yields from Treasuries increase, in general some investors will sell their non-Treasury holdings and transfer the capital into Treasuries. Some of those non-Treasury holdings will be REITs, and those investors’ sales will lower REIT stock prices by enough so that the REIT yield also increases, maintaining the same difference between them—that is, maintaining a constant spread. (The process works in reverse, too.) If the spread widens (or narrows), however, that may be a sign that investors have over-reacted, leaving an opportunity for astute investors to earn better-than-normal returns. So a change in the REIT yield spread to Treasuries may mean a change in the “price” that investors must pay for a steady stream of income.
Equity REIT Price to NAV. Investors allocate investment capital to the real estate asset class for its combination of long-term total return (including capital appreciation as well as steady income) and low correlation to the non-real-estate equities and bonds in their portfolio, but they can buy exposure to the diversification benefits of real estate investments either on the public side of the market (listed equity REITs) or on the private side of the market (direct property holdings or, for institutional investors, private equity real estate funds). A REIT stock price premium (P-NAV > 0) indicates that real estate market exposure is cheaper in the private market, while a REIT stock price discount means real estate market exposure is cheaper in the public market. (Actually it’s normal for listed equity REITs to sell at a slight premium, around 1%-2%, because REITs have generally outperformed otherwise similar private equity real estate investments.)
Both valuation measures are actually more favorable now than they were at the beginning of this year. As of January 1st the listed equity REIT dividend yield to Treasuries was 1.47 percentage points (computed by subtracting the 2.49% yield on 10-year Treasuries from the 3.96% dividend yield on the FTSE NAREIT All Equity REIT Index), but at the beginning of September 2017 it had widened to 1.65 percentage points (3.85% minus 2.20%). That means that a steady income stream from Treasuries has become more expensive relative to an income stream (plus capital appreciation) from listed equity REITs.
Similarly, at the beginning of 2017 the equity REIT analyst company Green Street Advisors estimate the average P-NAV at -9%, but by the beginning of September they estimated that the discount had widened to -11%. In other words, the price of exposure to the real estate market cycle was already cheaper in the public market than in the private market, but public real estate had become an even better relative value.
So, what does all this say about future returns? As I’ve explained in my previous market commentaries, each of those valuation metrics—individually or in combination—can be used to form predictions about future total returns for listed equity REITs or the future outperformance of listed equity REITs relative to the broad stock market, or both. (They can also be used to predicted outperformance by listed equity REITs relative to private equity real estate, but that’s a topic for another market commentary.) The important caveat to keep in mind is this: any prediction works only to the extent that historical relationships continue to hold. Anyway, Chart 1 summarizes the predictions generated by these simple valuation metrics:
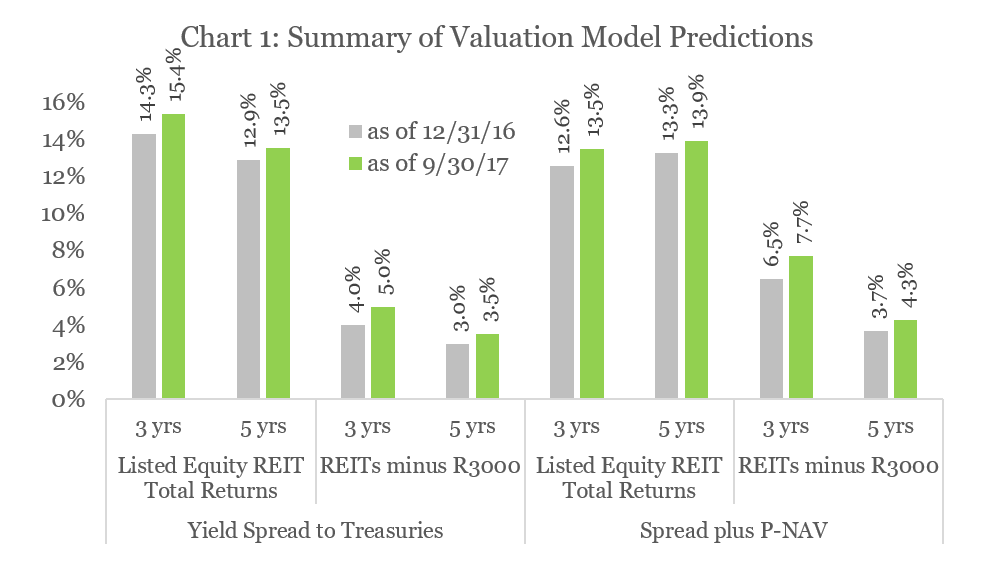
- The listed equity REIT dividend yield spread to Treasuries of +1.65% at the beginning of September suggests that, if the historical relationship continues to hold, listed equity REIT total returns should average about 15.4% per year over the next three years and 13.5% per year over the next five years. (The R-squared of the regression model is 0.44 for the three-year model and 0.38 for the five-year model, implying that 44% of the variation that we’ve observed historically in three-year average total returns and 38% of the variation in five-year average total returns has been “explained” by the dividend yield spread to Treasuries at the beginning of that multi-year period.)
- In comparison, the smaller yield spread of +1.47 as of the beginning of 2017 suggested that total returns might have been predicted at 14.3% per year over the following three years and 12.9% per year over the following five years.
- The same valuation metric suggests that listed equity REITs can be expected to outperform the broad U.S. stock market by about 5.0 percentage points per year over the next three years (with an R-squared of 0.33) and 3.5% per year over the next five years (R-squared 0.16).
- In comparison, the prediction as of the beginning of 2017 would have been for an outperformance of 4.0% per year over the following three years and 3.0% per year over the following five years.
- Combining the dividend yield spread to Treasuries with the estimated P-NAV of -11% at the beginning of September suggests that—again, if the historical relationship continues to hold—listed equity REIT total returns should average about 13.5% per year over the next three years and 13.9% over the next five years. (The R-squareds are 0.47 and 0.38.)
- In comparison, the smaller values for both the yield spread and the P-NAV discount as of the beginning of the year suggested that total returns might have been predicted at 12.6% per year over the following three years and 13.3% per year over the following five years.
- The same combination of valuation metrics suggests that listed equity REITs can be expected to outperform the broad U.S. stock market by about 7.7 percentage points per year over the next three years (R-squared 0.21) and 4.3 percentage points per year over the next five years (R-squared .07).
- In comparison, the prediction as of the beginning of 2017 would have been for an outperformance of 6.5% per year over the following three years and 3.7% per year over the following five years.
The importance of this sort of analysis, of course, is not the point estimates: it’s a pair of broader messages. First, these simple valuation metrics have, historically, been surprisingly successful at predicting both average total returns for listed equity REITs over subsequent multi-year periods and their performance relative to the broad stock market. Second, both valuation metrics are in markedly bullish territory, suggesting that REIT performance over the next several years can be expected to be strong, both on their own terms and relative to the broad market—and, in fact, they’ve become more bullish since the beginning of this year.
In other words, whether what you’re looking to purchase is simply the steady income typical of REITs and Treasuries or the broader performance and diversification benefits of the real estate asset class, the “price” for purchasing those investment return attributes through listed equity REITs is especially favorable now.
As always, if you have any comments or questions please drop me a note at bcase@nareit.com.