Investors became concerned in mid- to late-January about an increase in market volatility and in correlations among asset classes. I argued then that although volatilities had increased, they had done so from an extraordinarily low level and actually weren’t noticeably out of their normal range. Still, it’s nice to report that since that blip, both volatilities and correlations have come down, and are now firmly within their long-term normal ranges.
As I noted before, broad stock market volatility has usually varied between 12.3% and 20.2% with a median of 15.8%, while annualized REIT volatility based on daily returns has usually been between 11.6% and 21.9% with a median of 15.1%. As you can see in this chart, stock market volatility was above its normal range from January 14th through February 24th, peaking above 23% in early February, but has been less than 20% since early March and less than 14% for the past three weeks. The uptick in REIT volatility was even shorter, with estimated volatilities above 21.9% only from January 21st through February 19th, and was most recently estimated at 11.8% using data through April 15th.
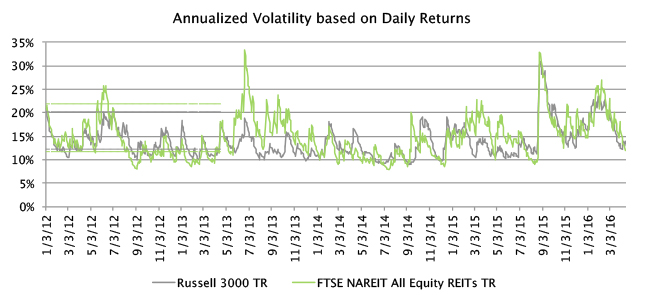
It’s worth remembering that volatility measures how much uncertainty investors have regarding the values of their assets: If investors have diverging views about future prospects for earnings, growth and dividends, then stock transaction prices will fluctuate and volatility will be elevated. It’s clear that investors have reached a level of comfort about both REIT and stock values since February.
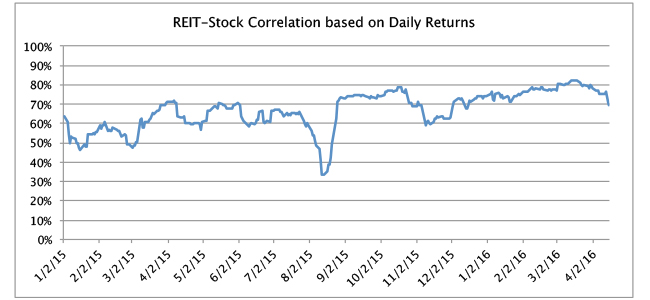
We can use daily data to estimate the REIT-stock correlation, too, even though correlations estimated from daily returns are not relevant for long-term investors. The REIT-stock correlation measured from daily data has usually ranged between 56.0% and 78.1%, but remained above its normal range for essentially all of March, peaking above 82% for a couple of days in the middle of the month. Since the end of March, however, the REIT-stock correlation has subsided into its long-term normal range and was most recently at 69.3%, very close to its long-term median. (From time to time, returns in the two asset classes move in strongly opposite directions—as they did for five straight days in August 2015, accounting for the strong dip that you see in the graph—reflecting significant differences in the fundamental signals coming from the real estate cycle and the business cycle that governs the rest of the stock market.)
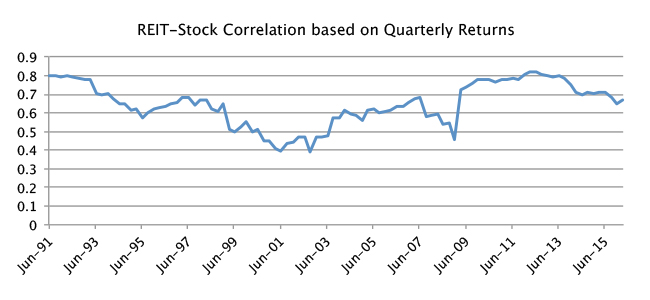
Investors with longer investment horizons—such as retirement investors and pension funds, as opposed to day-traders—should use returns measured over correspondingly longer investment horizons to measure correlations. The chart below, for example, shows the REIT-stock correlation over the past 25 years measured using quarterly returns. The REIT-stock correlation declined sharply during the 1990s, which I and many others attribute to the influx of institutional investors as the “modern REIT era” got underway, but then increased after the October 2001 decision to include REITs in the S&P 500 and other broad stock market indices. After peaking just slightly above 82% in early 2012—as both REIT and stock markets were recovering from the combined effects of the European debt crisis and the U.S. credit rating downgrade in August 2011—the REIT-stock correlation has fallen dramatically to its most recent level of just 66.8%.
Technical notes: Both volatilities and correlations are computed using a dynamic conditional correlation model with generalized autoregressive conditional heteroscedasticity (DCC-GARCH, developed by Nobel prize-winning economist Robert Engle). DCC-GARCH is pretty much the state of the art for this sort of analysis because it’s both accurate and sensitive to the most recent market conditions. REIT returns are measured by the FTSE NAREIT All Equity REIT Index, and stock market returns by the Russell 3000 index.