The total return on listed Equity REITs since stock market volatility spiked higher last August is 500 bps higher than the total return on the S&P 500. Moreover, REITs performed better than seven of the 10 headline Sectors according to the S&P/MSCI Global Industry Classification System (GICS®) (See chart below and column 1 of table).
What accounts for REITs’ relative performance during this period of market turbulence?
- REITs have little or no exposure to energy prices. The slide in oil prices to below $30/bbl resulted in a 17% decline in energy stocks. Potential losses on bank loans to energy firms contributed to a 15.7% drop in financial stocks;
- REITs have largely domestic operations. A stronger dollar and slower economic growth abroad (especially China and Europe) have crimped exports and deflated the prices of non-energy commodities, partly explaining the 13.9% decline in materials stocks. Weaker demand in export markets has also weighed on industrial firms;
- REITs have stable income from long-term leases. REITs generate a significantly higher proportion of their total return through dividend payments than do most firms in the S&P 500. Since August, this steady income yield has contributed more than 100 bps of additional total return for Equity REITs compared to the S&P 500, helping moderate the impact of price fluctuations over this period.
GICS will increase the number of headline Sectors at the end of August, 2016, to include Real Estate as an 11th headline Sector.* The divergent trends of major market sectors since last August, and the performance of Equity REITs exceeding seven of the 10 current GICS sectors, underscore the importance of holding a diversified portfolio across all asset classes, including listed equity real estate, in order to potentially reduce the volatility of overall portfolio returns.
We present below a deep dive into the market movements by Sectors and the relative performance of REITs
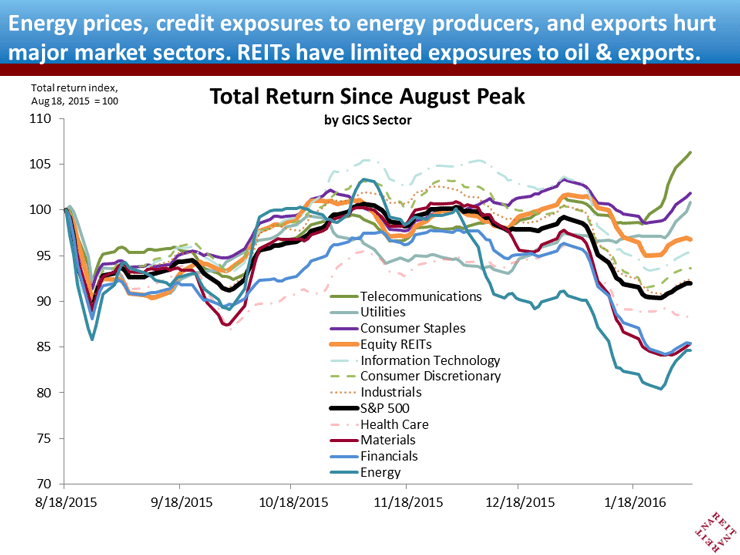
U.S. equity markets plunged 11% over five trading days from August 18th through August 25th. The chart nearby plots the level of the S&P 500 total return index, as well as all 10 headline Sectors according to GICS. The FTSE-NAREIT All Equity REIT Total Return Index is included as well. All Sectors are indexed to equal 100 on August 18th.
The initial decline was strikingly similar across all sectors, as fear and uncertainty about risks to the economic outlook were broadly felt, at least initially. Most Sectors posted double-digit declines, and every Sector fell at least 8% (column 2 of table).
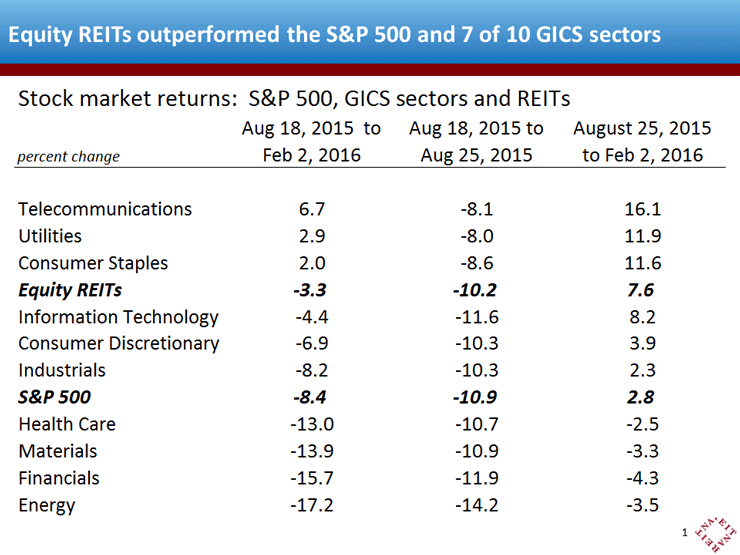
There are a variety of economic fundamentals that affect these sectors differently, however, and equity market returns have diverged widely since the low point last August. Three sectors—telecommunications, utilities and consumer staples—staged double-digit rebounds, and by early February stood above their August levels (column 3 of table, and top three lines along the right side of the chart). Other Sectors, however, continued to move down, and by early February, health care, materials, financials and energy stocks were all below the bottoms reached last August. The spread between the top-performing and bottom-performing sector over this period was nearly 24 percentage points.
* Until the changes in GICS are implemented, Equity REITs are included within the Financials Sector. The above-market relative performance of Equity REITs since last August boosted the performance of the Financials Sector as reported above.