I published a market commentary in February highlighting the dramatic difference in how essentially equivalent real estate assets were being valued by investors in the public and private markets—that is, how properties were being valued in the illiquid real estate market and how claims on basically the same properties were being valued in the share prices of exchange-traded equity REITs. There’s a close long-run relationship between the two parts of the real estate market, so the disconnect we’ve observed recently can’t last forever: the question is simply whether the gap will be closed through underperformance in what may be an overvalued private real estate market, overperformance in what seems very clearly to be an undervalued listed REIT market, or a little of both.
The latest data seems to indicate that “a little of both” is exactly what is happening.
Near the end of March the CoStar Group published the latest version of their CoStar Commercial Repeat Sale Index (CCRSI), which estimated quality-adjusted changes in the average transaction prices of properties during February. (It takes several weeks to compile data from property transactions, and transactions from the entire month have to be lumped together, so there’s a reporting lag of between four and eight weeks—which is pretty good, by the standards of the illiquid real estate market.) The CCRSI suggested that transaction prices in the illiquid real estate market had been declining for three consecutive months, December 2016 to February 2017, and have lost 3.4% from their November 2016 peak.
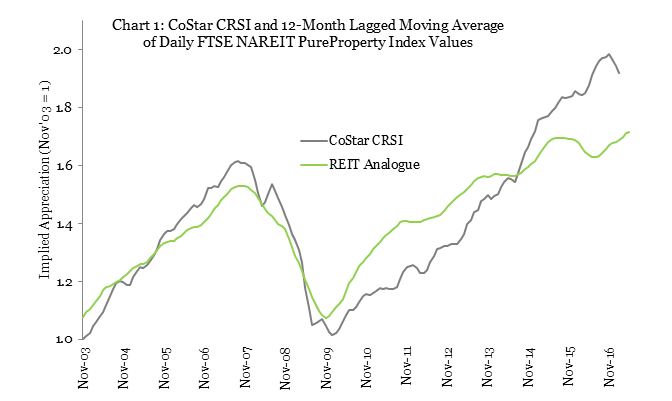
Making a comparison with public-market valuations requires correcting for the measurement problems that an index such as the CCRSI introduce: specifically, indices based on illiquid assets are lagged and smoothed relative to actual market values (even when those indices use transaction prices). Specifically, we can do a pretty good job of replicating the lag and smoothing of the CCRSI if we construct an index whose monthly values are a moving average of the daily values of the FTSE NAREIT PureProperty® Index over 12 previous months. Chart 1 shows how the two indices have compared over the available history of nearly 15 years since November 2002. The correlation between the actual CCRSI values and the 12-month lagged moving average of daily PureProperty values has been a surprisingly high 63%, but the recent disconnect that I noted in my earlier market commentary is clearly visible as a divergence between the two lines.
Most recently, though, there has been a marked closing of the gap between public and private real estate valuations—not just in the pronounced dip measured by the CCRSI during December, January, and February but also in an equally pronounced recovery measured by its REIT-based analogue. In fact, the REIT analogue (that is, the moving average of 12 months’ worth of daily PureProperty values) has now improved for 10 consecutive months, June 2016 through March 2017, and implies that property values (measured to be comparable to the CCRSI) have increased by 5.6% over that period.
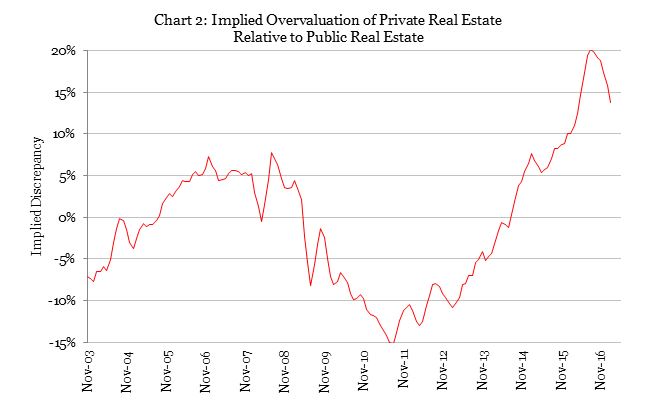
In short, a downward correction in an overvalued private real estate market has combined with an upward correction in an undervalued public real estate market to start closing the gap between them. Chart 2 shows that the gap between the two measures—that is, the implied overvaluation of real estate assets in the illiquid (private) market compared to the valuation of comparable assets in the liquid (exchange-traded) market—reached an all-time high of more than +20% in August 2016, but over the next six months declined to less than 14%.
Intriguingly, several other pieces of data are consistent with this closing-of-the-gap story. Both Institutional Real Estate and Preqin reported that private equity real estate funds had raised “anemic” amounts of new capital during the first quarter of 2017, as would be expected if investors were less-than-excited about deploying into overvalued assets. IRE even sounded a note almost of panic, saying “you have to wonder if we are in the beginning of a real downturn.” (The figures reported by the CCRSI can fairly be termed a “correction,” but anybody who paid the least attention to the strength of real estate operating fundamentals would not regard the current market as “a real downturn.”) Similarly, NAREIT’s T-Tracker® data, though not yet available for 2017Q1, showed that property acquisitions by exchange-traded equity REITs in 2016Q4 had plummeted 60% compared to two quarters previously while net acquisitions (purchases less sales) collapsed by an even more impressive 85%.
In stark contrast, exchange-traded REITs raised $23 billion in new capital through initial public offerings, secondary equity offerings, and corporate debt during the same quarter, more than ever before in the 47-year history of the REIT industry. Both the shifting of investor capital away from private equity real estate funds and into REITs and the sharp decline in property acquisitions by REITs are consistent with the idea that property values have been too high and are likely to decline while REIT values have been too low and are likely to increase.
As noted, though, the gap was still large at almost 14% during February 2017, implying that a great deal more “correction” will be needed to bring the public and private sides of the real estate market into alignment. It’s still not clear whether the remaining gap will be closed by continued decline in private-market valuations, continued recovery in public-market valuations, or—as we’ve seen over the last three months—some of both.