Over the past few days I’ve published the first three in a series of commentaries summarizing “where we stand” in the market for listed equity real estate investment returns. The first three focused respectively on returns, correlations, and diversification benefits. In the next few I’ll illustrate how many investors value listed REITs relative to competing investment opportunities and summarize where we stand according to each valuation method. While the purpose of valuation is to identify assets with especially good return prospects going forward, it’s very important to keep in mind that past performance is no guarantee of future performance—and, in particular, that a valuation “model” calibrated according to past returns cannot be assured of remaining valid even as a tool for predicting future returns.
One of the most regularly studied REIT valuation statistics is the REIT dividend yield spread to Treasuries. REIT dividends are quite stable: over the 26 years since the end of 1990 (roughly the “modern REIT era”) the annualized volatility of the monthly income return on the FTSE NAREIT All Equity REIT Index has been just 0.76%, or less than half the volatility of yields on 10-year Treasuries. (Note that income returns are not equivalent to yields.) If the yields available on other assets (such as Treasuries) increase, some investors will tend to sell their REIT holdings and transfer assets into Treasuries; that selling will tend to lower REIT stock prices by enough so that the REIT yield also increases, maintaining the same difference between them—that is, maintaining a constant spread. (The process works in reverse, too.) If the spread widens (or narrows), however, that may be a sign that investors have over-reacted, leaving an opportunity for astute investors to earn better-than-normal returns.
Since the end of 1990 the month-end industry-aggregate dividend yield for exchange-traded Equity REITs has averaged 1.09% more than the month-end yield on 10-year U.S. Treasury bonds. Even after recent increases in Treasury yields, the average yield spread for Equity REITs was still 1.47% at the end of 2016, which is in the top one-third of yield spreads seen during the modern REIT era. In other words, the spread is uncommonly wide.
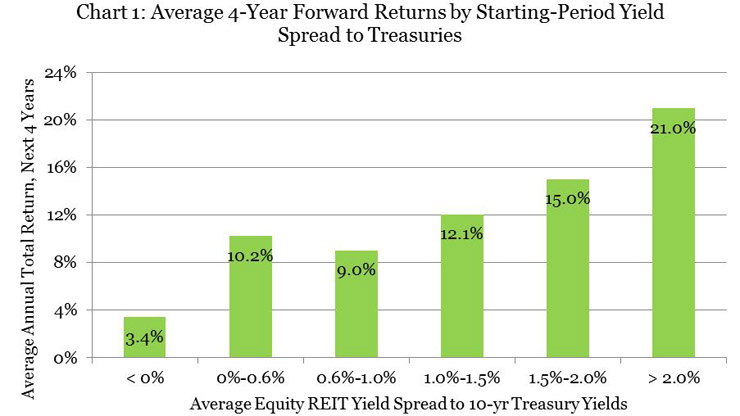
As Chart 1 shows, over that period, when the industry-aggregate dividend yield spread to Treasuries finished a month in the range of 1.0% to 1.5%, total returns over the next four years averaged 12.1% per year (with a median of 11.6% per year), and when spreads were in the nearby range 1.5% to 2.0%, total returns over the next four years averaged 15.0% per year (with a median of 14.2% per year).
In fact, the relationship between Treasury yield spreads and four-year subsequent REIT returns can be modeled with a simple regression relationship that suggests that, since December 1990, four-year average total returns have tended to be about 6.61% plus 4.71 times the yield spread at the beginning of the period. (Note: I also modeled returns over the next three years and the next five years; more about that later.) The relationship “explained” forward-looking average total returns pretty well, with an R-squared of 45%. If that regression relationship continues to hold over the next four years, the yield spread at the end of 2016 suggests that total returns on exchange-traded Equity REITs would average about 13.5% per year.
The problem with estimating that sort of relationship using past data and then using it to guess the future is that our measures of its explanatory power—the R-squared, for example—are based only on how it “explained” past data, not on how successfully it would have guessed the future. To get a handle on that question one can estimate the relationship using old data, using it to guess a date that is in our past but would have been in the model’s future; one can then recursively update the model and its future-guesses to see how much the model changed and how accurate its future-guesses were. (You’ll notice I’m avoiding words like “forecasts” or “predictions,” because what I’m doing here doesn’t rise to the level of a forecast or prediction.)
Let’s say, for example, that at the end of 1994—four years after the advent of the modern REIT era—I had used all of the data then available on the monthly dividend yield spreads from January 1972 to December 1990 (that is, over the 19 years of the “pre-modern era”) and on the total returns of exchange-traded Equity REITs over the subsequent four years (with the latest period ending in December 1994) to estimate the same sort of relationship. As time passed, each time one more month became available I could have dropped the oldest month, maintaining a rolling 19-year window and re-estimating the model. (A 19-year window is handy because it extends fully across the real estate market cycle, which seems to have a reasonably stable duration averaging around 18 years.) By the end of 2016 I would have estimated the relationship 265 times.
Now let’s use all 265 models to see what they would have future-guessed based on the end-of-2016 yield spread of +1.47%:
- The most bearish model was the one that used yield spreads from August 1979 to July 1998 and returns from July 1998 to July 2002, and based on the current spread of 1.47% it would future-guess returns averaging 8.43% per year over the next four years.
- The most bullish model used spreads from April 1974 to March 1993 and returns from March 1993 to March 1997, and based on the current spreads it would future-guess returns averaging 15.81% per year over the next four years.
- The most recent model used spreads from January 1994 to December 2012 and returns from December 2012 to December 2016: it says forward-looking total returns tended to be about 5.37% plus 5.06 times the beginning-of-period yield spread, and based on the current spread of 1.47% it would future-guess returns averaging 12.81% per year over the next four years.
- Half of all models would future-guess returns averaging between 11.38% and 14.57% per year over the next four years. (Another ¼ of the months would imply guesses averaging less than 11.38%, and the last ¼ would imply guesses averaging more than 14.57%.)
Now, what if we used forward returns over three-year periods or five-year periods instead of four-year periods? It just doesn’t make very much difference. For example, half of the three-year models (277 of them) provide future-guesses of total returns over the next three years of between 11.84% and 15.48% per year based on today’s yield spread of 1.47%; the most recent model future-guesses 13.22% per year. Half of the five-year models (243 of them) provide future-guesses of total returns over the next five years of between 11.62% and 14.09% per year; the most recent model future-guesses 12.40% per year.
So what’s the overall conclusion? It bears worth repeating: past returns are no guarantee of future performance; even the past relationship between the Equity REIT dividend yield spread to 10-year Treasuries is no guarantee that the relationship will continue to hold in the future. The bottom line, though, is a simple one: the yield spread to Treasuries as of the end of 2016 was in the bullish part of its historic range—and if a wide variety of estimates of the past relationship between spreads and forward-looking returns continues to hold, that currently bullish spread would suggest relatively bullish future total returns for investors in exchange-traded Equity REITs, in the range of something like 11.4% to 15.5% per year on average over the next three to five years.