I’ve noted in other recent market commentaries that exchange-traded REITs seem to be undervalued, in the sense that multiple valuation metrics that have historically been reliable predictors of future total returns are in distinctly bullish ranges. For example, if the historical relationship between the average equity REIT dividend yield spread to 10-year Treasury securities and future Equity REIT total returns continues to hold, then the spread at the end of June (+1.66%) suggests that Equity REIT total returns may average something like 14% per year over the next four years and outperform the broad stock market by something like 5 percentage points per year over the next three years; the same analysis applied to Mortgage REITs suggests that they may provide total returns averaging something like 10% per year over the next two years. (I report results for the forward-looking period over which each valuation metric has historically shown the most predictive power.) The empirical approach suggests similar conclusions when we apply it to measures of yields on other income-producing assets such as high-yield corporate bonds and high-quality corporate bonds, and also when we use estimates of the spread between REIT stock prices and net asset values (P-NAV).
It’s possible to use a similar analysis to get some idea of relative sector valuation, too: specifically, which segments of the REIT industry seem to be even more undervalued than others. It’s important not to demand too much from this sort of exercise: it’s no substitute for looking carefully at operating fundamentals (occupancy rates, rent growth, construction activity, etc.) in each segment, nor does it substitute for forming a judgment about the management skills of each REIT’s executive leadership. Think of this as a rough cut, a first step to understanding the individual companies and making informed investment decisions.
At the end of June the average dividend yield of self-storage REITs was 4.05%. Historically speaking, that is basically normal for self-storage REITs: in fact, the median month-end value since the beginning of 1994 has been 4.03%. By itself, though, dividend yield does not have very much predictive power: what has done a pretty good job historically of predicting future total returns (with an R-squared of 60%) is the dividend yield spread to 10-year Treasuries. With the Treasury yield at just 2.19%, the yield spread for self-storage REITs at the end of June was 1.86%—which is extraordinarily large by historical standards. In fact, for self-storage REITs the yield spread to Treasuries has exceeded 1.86% during only 5% of months (just 14 of them, to be exact) since the end of 1994:
- The spread was larger during a 10-month stretch from September 2002 through June 2003; from the beginning of that period until five years after it ended the total returns for self-storage REITs averaged more than 19% per year.
- The spread was also larger at the bottom of the liquidity crisis, January – March 2009; from the beginning of that period until five years after it ended the total returns for self-storage REITs averaged more than 28% per year.
- And the spread was larger at the end of exactly one other month, October 2016.
Another sector with an especially large dividend yield spread is Retail—especially Regional Mall REITs, though the analysis leads to similar conclusions for the Shopping Center and Free Standing sub-sectors. At the end of June the average dividend yield of retail REITs was 4.76%, meaning the yield spread to 10-year Treasuries was 2.57%. As with the Self-Storage sector, although the dividend yield itself is nothing special (in fact it’s slightly below the historical median) the yield spread is extraordinarily large. We’ve seen larger dividend yields in Retail REITs during only 15% of historical months:
- The spread was larger at the end of most of the months from October 1998 to June 2003; from the beginning of that period until five years after it ended the total returns for retail REITs averaged more than 15% per year.
- The spread was also larger during the liquidity crisis, October 2008 – April 2009; from the beginning of that period until five years after it ended the total returns for retail REITs averaged nearly 17% per year.
- And the spread was larger at the end of exactly one other month, May 2017.
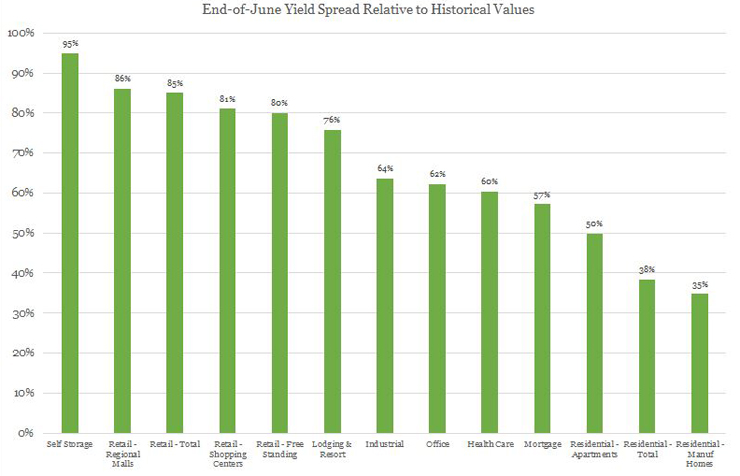
In some cases the best predictive performance has come from computing yield spreads relative to high-yield corporate bonds rather than Treasuries, and in most cases the predictive power of the valuation metric has been more powerful over a shorter future period rather than the five-year periods I’ve been focusing on. But you get the picture: historically speaking, when REIT dividend yields reached especially large spreads relative to Treasuries, total returns over the next several years have tended to be especially large. And yield spreads at the end of June were in distinctly bullish territory for essentially every sector of the REIT market:
- Yield spreads in the Lodging/Resort sector have been higher than June’s 2.75% value at the end of only 24% of months since the beginning of 1994.
- The Industrial sector has seen higher yield spreads at the end of only 36% of months.
- The Office sector has seen higher spreads at the end of only 38% of months.
- The Health Care sector has seen higher spreads at the end of only 40% of months.
- Mortgage REITs have seen higher yield spreads at the end of only 43% of months.
In fact, only in the Residential sector was the end-of-June yield spread at all high by historical standards. That’s driven by the Manufactured Homes sub-sector, where 65% of historical month-ends have seen higher yield spreads than 0.51%, the value as of the end of June; the spread of 0.99% for the much larger Apartment sub-sector was exactly at the long-term median. That’s not exactly bad news, though, given that the Residential sector has been among the best-performing parts of the REIT market since sector performance data first became available, with total returns in both sub-sectors averaging 12.0% per year since the beginning of 1994—exceeded only by Self Storage (15.5%) and Health Care (12.2%).
I haven’t talked about segments of the REIT market for which we don’t have data extending all the way back to 1994, such as the Home Mortgage and Commercial Mortgage sub-sectors (where returns started being measured in January 2000) and the Timberland and Infrastructure sectors (January 2011 and February 2012 respectively), nor have I done the same analysis of the Diversified sector because the constituent companies are more heterogeneous and therefore the same sector-level analysis is less meaningful.
Also, as I noted at the beginning, this sort of analysis is useful mainly as a “rough cut,” or perhaps a “flag” to signal that investors should be paying closer attention. And maybe that’s the most important conclusion: while valuations are somewhat different across different segments of the REIT industry, there is a “wealth of undervaluation” in REITs today—and investors certainly should be paying closer attention.