January 2021
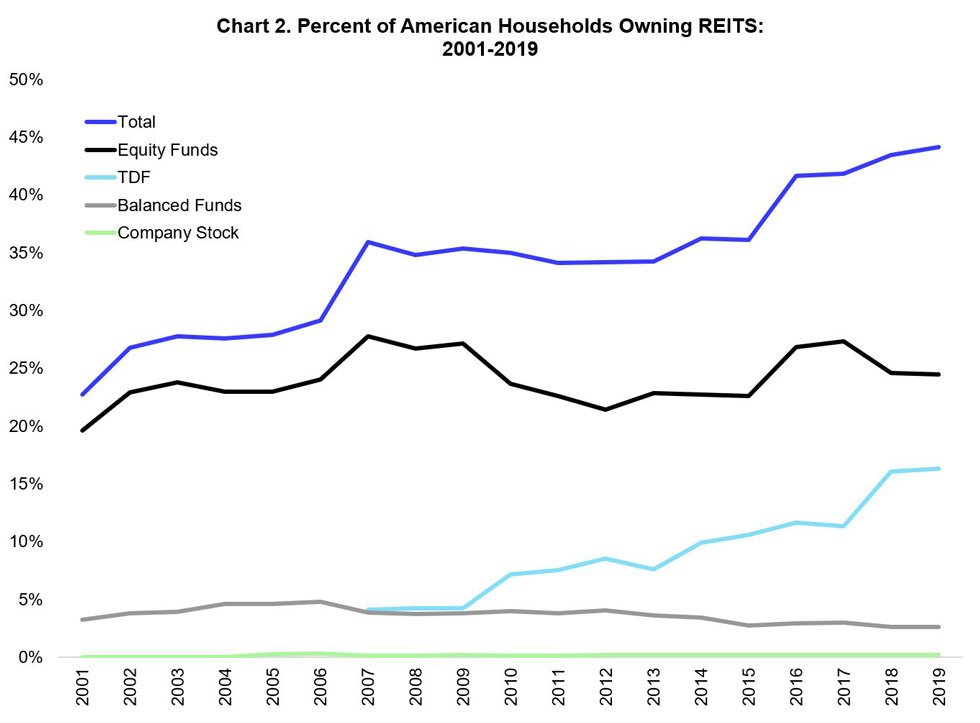
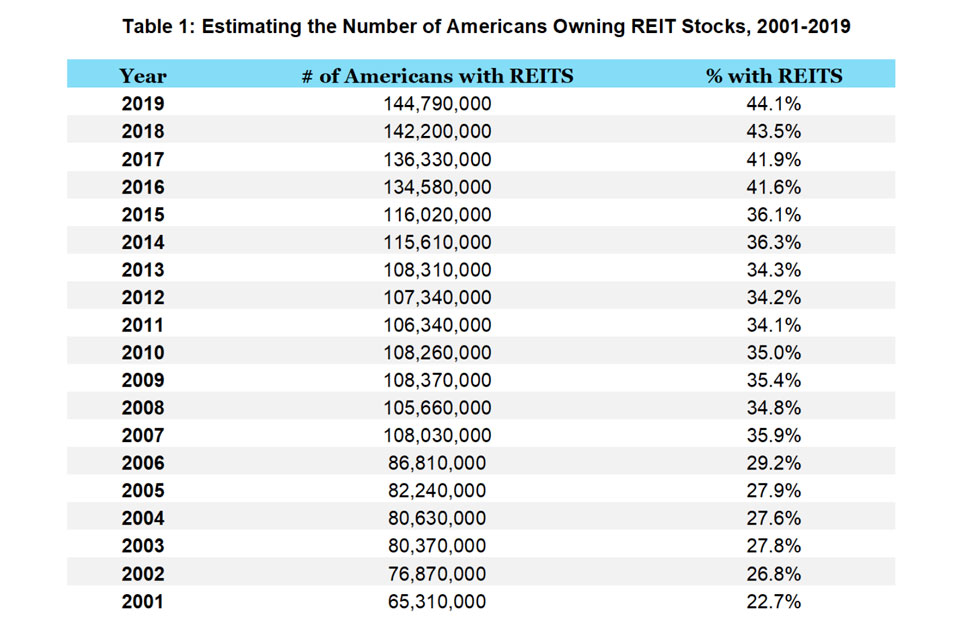
This research estimates the number of Americans and American households that own REIT stocks annually over the period 2001 to 2019. Roughly 65 million Americans owned REIT shares in 2001, this more than doubled to nearly 145 million Americans that owned REIT shares in 2019. The percentage of American households with REIT stocks has also nearly doubled from 23% to 44% through the last two decades. Table 1 and Charts 1 and 2 summarize the findings of the analysis.
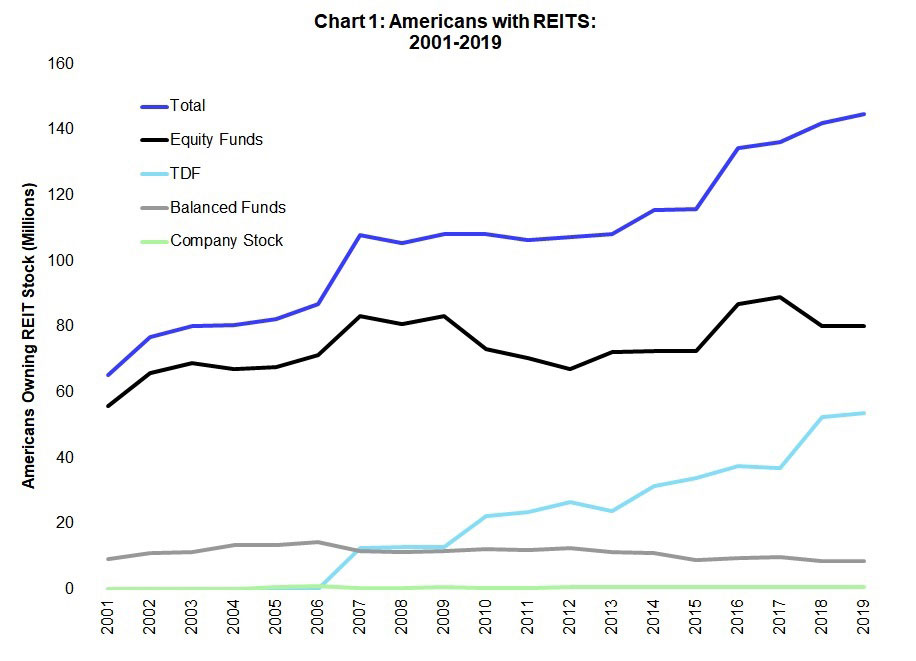
The main reasons for the increase in American-owned REIT stocks since 2001 include:
- Significant increases in REIT exposure in general equity funds.
- Introduction of target date funds and increases in REIT exposure in these funds.
- Increases in the number of households.
REIT exposure in equity funds has increased nearly 30 percentage points since 2001, while household exposure to these funds has remained constant.1 Significant use of target date funds (TDFs) began in 2007, and these funds include moderate REIT exposure. TDFs have had significant increases in exposure within 401(k) plans, improving from 7.6% in 2007 to 23.5% in 2019.2 Nearly 80% of TDFs have some REIT exposure in 2007; this has increased to just under 100% in 2019. The total number of American households has also increased from 105 million in 2001 to 129 million in 2019,3 providing REIT stocks with a larger base.
Methodology
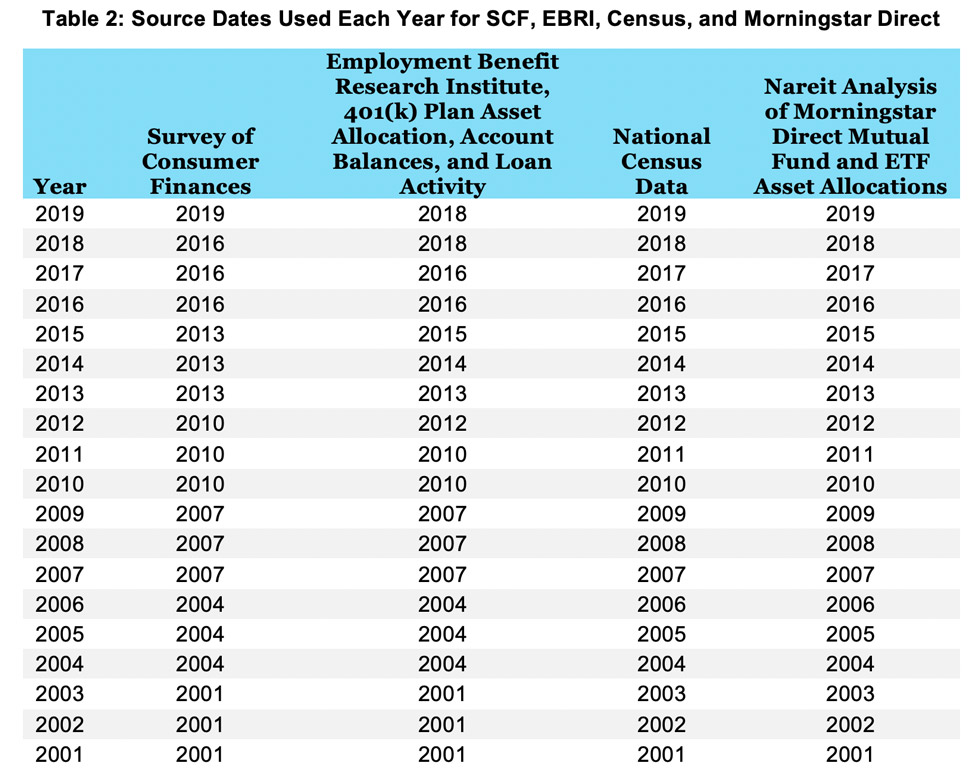
The key sources of data for this analysis are the Federal Reserve Board Survey of Consumer Finances (SCF), the Employment Benefit Research Institute data on 401(k) equity allocations (EBRI), Census population and household counts starting from 2001, and Nareit analysis of Morningstar Direct data on asset-weighted REIT exposures by investment product type (mutual fund and ETF asset allocations).
SCF shares of homeownership equity were multiplied by the number of households each year to get the total number of households owning equities. EBRI data on 401(k) equity allocation was divided into four categories of funds with REIT exposure; equity, target date, balanced, and company stock. The shares allocated to each fund was recorded for each year available from EBRI. Lastly, yearly shares of REIT exposure within each fund type were pulled from Morningstar Direct and recorded. Multiplying the shares of equity holdings, the share of REIT exposure, and the total number of households with equities for each fund type and adding the totals together gave the number of households with REITs. Census data was used to calculate the percentage of households with REITs and the total number of Americans with REITs. Note that for each source of data used, the analysis used the most recently published data each year as described in Table 2.
Defining Historical Share of Households with Equity Ownership
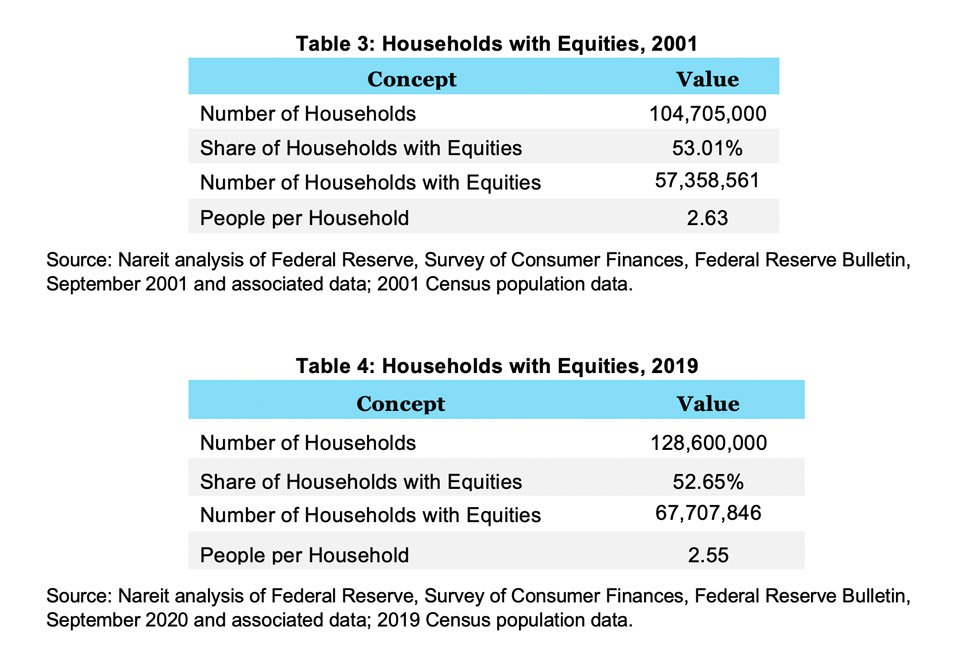
The SCF reports in 2019 that 52.7% of households have equity exposures,4 down slightly from 2001 (53.0%).5 The most common type of equity exposure includes ownership through a tax deferred retirement account (direct stock, direct holding of pooled investment funds, and other managed assets). The predominance of tax deferred retirement account based ownership will be used below as a key assumption.
Tables 3 and 4 show the number of households and the average number of people per household as derived from SCF data in 2001 and 2019, respectively. Total household gains since 2001 were just under 24 million, while average household size fell 0.08. Although the total share of households with equities fell 0.36 percentage points, the number of households with equities increased over 10 million.
Estimating REIT Ownership Among Equity Owners
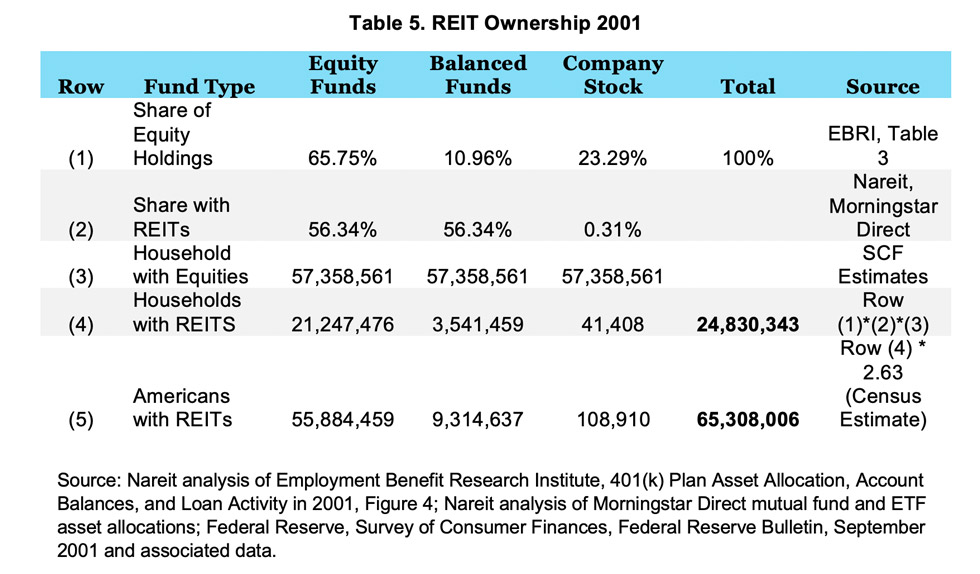
As noted above, the dominant form of stock ownership is through a tax deferred retirement account, most typically through an employer sponsored 401(k) plan. EBRI estimates the average asset allocation in 401(k) accounts.6 EBRI divides equity ownership vehicles into four categories, which are treated as mutually exclusive by EBRI and for this analysis. The four categories are equity funds, target date funds, balanced funds, and company stock. These shares are shown in row (1) of Tables 4 and 5.
- Using Morningstar Direct data, we estimate the percentage of assets that have any REIT exposure, and these results are shown in row (2) of Tables 4 and 5. REIT exposure from equity funds has increased dramatically since 2001, moving from 56.3% to 88.3% in 2019. Furthermore, these estimates are likely to be conservative because broad-based passive funds are more likely to have REIT exposure and are popular in 401(k) plans.
- Target date funds were virtually nonexistent in 2001. Following EBRI, we begin accounting for these funds in 2007. We estimate that 77.8% of TDFs had REIT exposure in 2007. In 2019, nearly 100% of all TDFs have REIT exposure.
- Balanced funds: In this analysis, we assumed these funds to be the same as generalist equity funds.
- Company stock: This approximates REIT’s share of equity market capitalization in the S&P 1500. Thus, we assume that 0.31% of company stock contained REIT exposure in 2001, and this has increased to 4.26% in 2019.
Multiplying the share of fund ownership by the share of funds with REITs by the number of households with equities and summing across fund types yields the total number of households with REITs. As shown in row (4) of Tables 4 and 5, the number of households that have REITs in 2019 is more than double the number in 2001. Finally, multiplying the number of households by the average number of people per household from Census data (2.52), yields approximately 65 million Americans in households with REIT ownership in 2001, and nearly 145 million in 2019.
Changes in Household REIT Shares
The primary causes for increased REIT ownership within households were the increased shares of REIT exposure in equity and target date funds. To demonstrate this, consider the following counterfactual. If we apply the equity fund REIT exposures from 2019 to equity ownership in 2001, the share of households with REITs increased from 22.7% to 33.7%. Since the share of households with equities only increased slightly from 52.7% in 2001 to 53.0% in 2019, the 10 percentage point increase in REIT household ownership is mostly a direct effect of the large increase in REIT exposure within equity funds (56.3% in 2001 to 88.3% in 2019). Similarly, applying the 2019 TDFs REIT exposures to the 2007 data, result in the share of households with REITs increasing from 35.9% to 37.1%. When applying both shares (equity and TDF REIT exposure from 2019) to the 2007 data, REIT household ownership increased from 35.9% to 40.7%. This explains nearly 60% of the change in household REIT ownership from 2007 to 2019. The other 40% of change mainly rises from the increased prevalence of TDFs in retirement accounts. TDF shares of equity holdings rose 21 percentage points from 2007 to 2019, while equity fund holdings fell off roughly 12.5 percentage points. These changes helped increase REIT ownership because on average there is more REIT exposure in TDFs than in equity funds. When applying the 2019 shares of equity holdings to the 2007 data for equity funds and TDFs, REIT household ownership increased from 35.9% to 39.5%
Summary: Estimating the Number of Americans Owning REIT Stocks, 2001-2019
- SCF data on household equity shares is multiplied by the number of households from the Census to get the number of households owning equities
- 401(k) asset plans from EBRI are divided into 4 mutually exclusive fund categories: general equity funds, TDFs, balanced funds, and company stock. The share of each fund within the plans are calculated
- The share of REIT exposure within each of these fund categories is calculated using Morningstar Direct
- The number of households with REITs is calculated by multiplying together REIT asset exposure, share of fund ownership, and the number of households owning equities for each fund type to get the number of households owning REITs within that fund type
- Summing the totals for all 4 fund types gives the total number of households owning REITs
- Multiplying the total number of households owning REITs by Census data on average household size and adults per household gives the total number of Americans with REITs and Adults with REITs, respectively
- The ratio of Americans households with REITs to the total number of American households each year is recorded.
Download a PDF of this research.
[1] Federal Reserve, Survey of Consumer Finances, Federal Reserve Bulletin, September 2001-September 2020.
[2] Employment Benefit Research Institute, Issue Brief No. 402 & No. 514, What Does Consistent Participation in 401(k) Plans Generate? Changes in 401(k) Plan Account Balances, 2007-2012, Figure 8, & 2010-2018, Figure 7.
[3] Census Bureau, National Census Data, 2001-2019.
[4] Federal Reserve, Survey of Consumer Finances, Federal Reserve Bulletin, September 2020.
[5] Federal Reserve, Survey of Consumer Finances, Federal Reserve Bulletin, September 2001.
[6] Employment Benefit Research Institute, Issue Brief No. 514, What Does Consistent Participation in 401(k) Plans Generate? Changes in 401(k) Plan Account Balances, 2010–2018, Figure 7.