May 18, 2020 - Nareit is surveying its membership about monthly rent collections in the wake of the COVID-19 pandemic and related closures. The May results show that on average for REITs the share of typical rent collected in May was largely unchanged from April. This suggests that while REIT tenants in some hard-hit sectors continue to struggle, their ability to pay rent did not appreciably worsen despite the widespread shutdowns in April.
Nareit's survey covers listed equity REITs who jointly own and operate between 10% and 20% of commercial real estate in the U.S.
Table 1 shows the estimated REIT rent collections in April and May as a share of typical rent collections. The results are displayed by property sector and are weighted by respondent REIT equity market capitalization.
A total of 43 equity REITs are included in the sample across the six property sectors (industrial, apartments, office, health care, free standing retail, and shopping centers). The sample represents 63% of the FTSE All REITs total equity market capitalization for those property sectors. Sectors are only reported where survey participation is sufficient to maintain participant confidentiality.
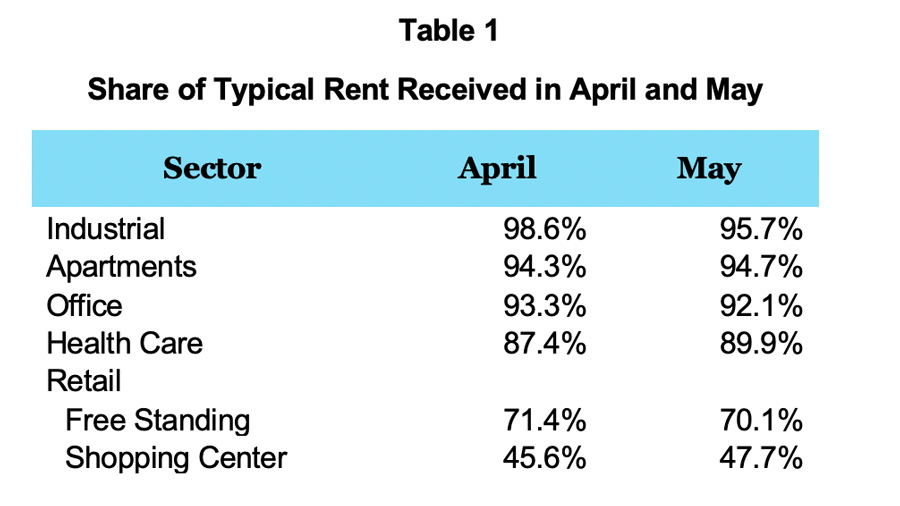
Source: Equity market capitalization weighted. Nareit survey of members, public disclosures, and FTSE Nareit All REIT index equity market capitalization as of April 30, 2020 via FactSet.
Results
- The industrial sector remained the strongest performer with collections equal to nearly 96% of typical rents in May. This reflects a drop of just under 3 percentage points from the nearly 99% of rents collected as reported in April. Industrial REITs own nearly 4,900 industrial properties in the U.S.
- Apartment collections remained strong for May and were substantially the same as April with 95% of typical rents collected.
- By equity market cap, more than half of apartment REITs in the sample received more or the same share of rent collected in May than April. May survey respondents reported granting rent deferrals for 3% of rent owed.
- The continued ability of apartment renters to meet their rent obligations reflects both the federal government stimulus, including enhanced unemployment benefits, and the fact that REIT apartments generally serve a population less likely to be affected by layoffs.
- The office sector's May rent collections experienced a slight decline to 92% in May from 93% in April. There are nearly 1,800 REIT-owned office properties in the U.S..
- The health care sector results reflect a mix of business models, with over 4,500 senior residential properties and over 2,800 medical facilities including hospitals and medical office buildings. All REITs in the sample saw an uptick in rents collected for May, raising the share of typical rents collected from 87% in April to 90% in May. May survey respondents reported granting rent deferrals for 5% of rent owed.
- In the retail sector, there are three sub sectors: shopping centers, regional malls, and free standing retail. Survey participation did not warrant the release of results for malls. The prevalence of essential businesses such as grocery and drug stores among the tenant base for many shopping center and free standing REITs is a stabilizing factor for these types of retail properties.
- There are over 16,000 REIT-owned free standing retail establishments across the U.S. including big box stores, pharmacies, convenience stores and restaurants. May results for free standing steady 70% of typical rents paid, down from 71% in April. May survey respondents in free standing reported granting rent deferrals for nearly 18% of their May rent.
- The U.S. has almost 2,700 REIT-owned shopping centers. Shopping center REITs reported 48% of typical rents were collected in May a two-percentage point improvement over April rents collected.
Methodology
This research note uses data from Nareit’s April and May rent surveys and publicly disclosed data matched to April’s month-end equity market capitalization. April survey results and updates were previously published here and here. Adding public disclosures did not significantly change results and April survey results tracked closely with rent disclosures included in 2020 Q1 earnings.
The results presented in this note are from a matched sample of REITs with valid rent collection data for April and May. The rents for April and May are from either the Nareit surveys or public disclosures. Using a matched sample ensures that changes in results between April and May are not due to the changing composition of the sample. However, in general, the results do not differ significantly if we use all the available data for each month or restrict the sample to only Nareit survey respondents.
Several REITs both responded to the surveys and publicly disclosed their April and May rents; the survey data is used in this analysis. The survey asked respondents both the percent of rent collected and the percent of rent typically collected in the same month. In public disclosures, some REITs only disclosed the percent of rent collected. In those cases, we assume typical rent collected is 100%. Some REITs collected more than their typical amount of rent in May. We top coded the share of rent received at 100%.