Research Summary
Beyond the Three Approaches: How Valuation Support Indicators Can Strengthen CRE Appraisals in Volatile Markets
Editor’s note: This is a guest market commentary written for Nareit by Jeffery D. Fisher, professor emeritus at Indiana University and visiting professor at Johns Hopkins University. He is also president of the Homer Hoyt Institute and consulting director of research and education for the National Council of Real Estate Investment Fiduciaries (NCREIF). He is a member of the Real Estate Counseling Group of America (RECGA) and was a founding trustee of The Appraisal Foundation.
Introduction
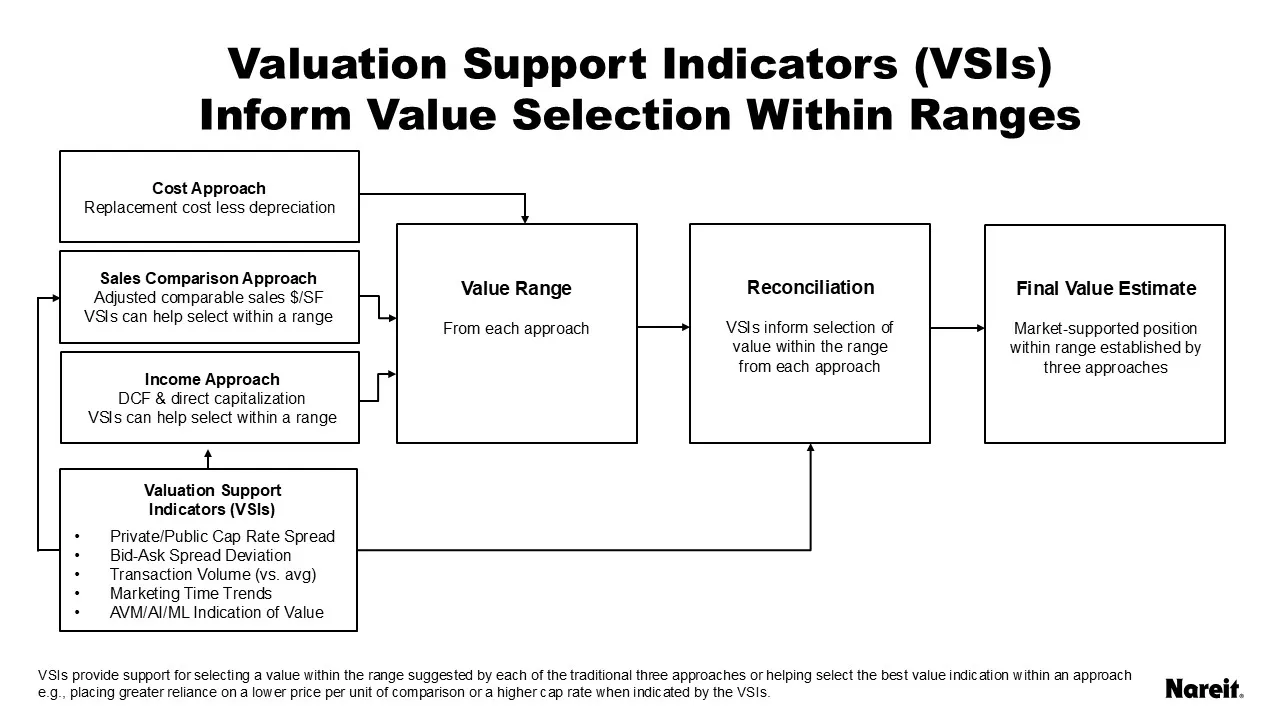
The traditional real estate appraisal process works reliably during relatively stable real estate markets but reliance on the three established approaches—cost, sales comparison, and income—can be challenging when markets are volatile. During periods of rapid price change—particularly in distressed or depressed markets—appraisers face difficulty justifying value selections at the extreme end of the indicated range, even when market signals such as the widening dispersion between public and private market pricing suggest those extremes may be warranted. This paper proposes Valuation Support Indicators (VSIs)—a supplemental framework designed to assist appraisers in reconciling value indications from the three traditional approaches by providing market-based rationale for selecting a defensible point estimate within the range each approach establishes.
This commentary is an abstract of a paper that was originally supported and published by the UF Bergstrom Center. The full paper can be found here.
Valuation Support Indicators (VSIs) in the Appraisal Process
The following five VSIs represent potential ways to inform—not replace—the reconciliation process, supporting the selection of values within established ranges (such as placing greater reliance on a lower price per unit of comparison or a higher cap rate) when market conditions warrant.
Public Market Indicator
To use this indicator, the appraiser calculates the implied capitalization rate for the relevant REIT sector by dividing estimated portfolio net operating income by enterprise value. This REIT-implied rate is then compared to the capitalization rate used in the traditional appraisal. If the REIT-implied rate is higher, indicating that public investors are pricing real estate at lower values, a downward adjustment is applied to the traditional value conclusion.
Marketing Time Indicator
To use this indicator, the appraiser gathers data on current marketing times from listing services, broker reports, and transaction databases. If current marketing periods exceed historical norms by a significant margin, this supports selecting a value toward the lower end of the range—such as placing greater reliance on a lower price per unit of comparison. The strength of the signal corresponds to the degree of departure from normal marketing conditions—modest extensions provide modest support for lower-range values, while severely extended marketing periods provide stronger support.
Bid-Ask Spread Indicator
To use this indicator, the appraiser gathers bid-ask spread data from broker surveys, listing price versus sale price comparisons, and market participant interviews. When spreads are severely widened, this indicator supports selecting a value toward the lower end of the range suggested by the traditional approaches—reflecting the concession from asking price that would likely be required to attract a buyer and complete a transaction.
Transaction Volume Indicator
This indicator explicitly ties the strength of the signal to liquidity conditions. The methodology is to first establish a baseline transaction volume (e.g., trailing 5-year average quarterly volume by property type and market). Then calculate current volume as a percentage of baseline. When volume drops below a threshold (e.g., 60% of baseline), this indicator supports selecting a value toward the lower end of the range suggested by the traditional approaches. The strength of the signal is scaled to the severity of the volume decline, based on the ratio of the current quarter transaction volume to the baseline average volume.
AVM/AI/ML Divergence Indicator
To use this indicator, the appraiser compares the value indication from a recognized AVM or ML model to the value range established by the traditional approaches. When the AVM/ML value is materially lower than the traditional appraisal range, this divergence may indicate that the model has captured market signals—such as shifts in investor sentiment, emerging comparable transactions, or broader economic indicators—that have not yet been fully reflected in the comparable sales, income projections, or cost estimates used in the traditional analysis.
Conclusion
These five VSIs are designed to inform—not replace—the reconciliation of value indications from the three traditional approaches (cost, sales comparison, and income). The VSIs address related but distinct aspects of market dislocation and should be considered together when informing where within the range the appraiser should select a value. Because all five phenomena often occur simultaneously during market stress, the VSIs can be weighed to determine the overall direction and strength of their signal. When the weighted VSIs indicate market stress, they support selecting a value toward the lower end of the range suggested by each of the traditional approaches—such as placing greater reliance on a lower price per unit of comparison or a higher cap rate. Wider adoption of VSIs would help align appraisal practice more closely with the full spectrum of market evidence available to practitioners and reviewers alike.